[Sports] UEFA Euro 2016 Predictions – Model
Today we’re launching our own predictions for UEFA Euro 2016 that starts next week.
A model for football: state of the art
There are many ways to build a model to predict football results. The Elo ranking system is commonly used. As it name indicates, it relies on a ranking of the international football teams, either the official FIFA ratings (which are widely known as poorly predictive of a team’s strength) or a custom made Elo ranking. A few Elo rankings are available on the Internet, so one possibility was to use one of these to compute probabilities for each game (via a very simple analytical formula). But we wanted to do something different.
When FiveThirtyEight created a nice viz of their own showing odds for the men’s and women’s world cups, their model was based on ESPN’s Soccer Power Index (SPI). The principle of the SPI is quite simple: compute expected scored and against goals for each team under the assumption it plays against an “average” football squad. Then run a logistic regression to predict the outcome of any two teams, based on their expected performance against the “average” team. SPI takes an impressive amount of relevant parameters into account (including player performance), and has generally proven itself reliable (although FiveThirtyEight’s predictions always seemed a tad overconfident to me!).
Our very own model
For our model, we liked the principle of the SPI very much, but we wanted to try our own little variation. So we kept the core feature of the SPI: computing the expected goals scored and against for each team, but we chose to directly plug these results into our simulations (i.e without the logistic regression). Of course, due to lack of time and resources, our model will be way less sophisticated than ESPN’s (there was no way we could include player performance for example), but still the results might be worth analyzing!
So, for each one of the 24 teams competing, we’re trying to predict the quantitative variable that is the number of goals scored (and against) for each game. Of course, we’re going to use all our knowledge of machine learning to achieve this 😉 Our training data is composed of the 1795 international games played by the 24 teams that qualified for UEFA Euro 2016 between 2008 and 2016 (excluding the Olympics, which are too peculiar in football to be relevant).
We dispose of 1795 observations, for each of which we know: the location of the game, the teams that played, the final score and the type of the game (friendly, world cup qualifier, etc.). We matched each team to its Fifa ranking at the closest date available, and determine which team had home court advantage (if any).
Then we ran the simplest of regression models: a linear regression on year, team (as a categorical variable), dummy variable indicating if team plays at home or away, type of match and FIFA rankings of both teams. Before even thinking of using this model for simulations, we have to look at how it performs. And a lot of think indicates that it is too unsophisticated. The most telling example might be the prediction of large number of goals. Let’s plot the number of goals scored vs. the FIFA ranking of the opposing team.
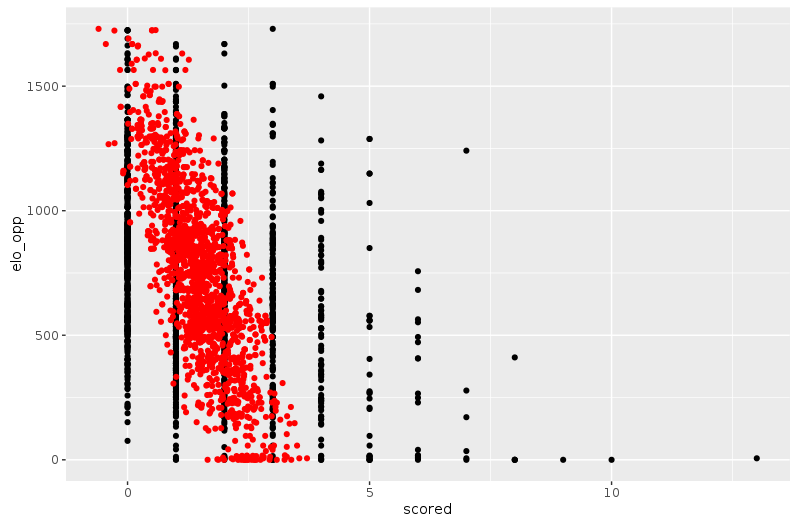
You can see on the right side of the plot that it’s not that rare that a large number of goals is scored, especially when playing a very weak team. However, the linear model is unable to predict more than 4 goals scored in a game. This can be a huge problem for simulations as ties are broken by number of goals scored at Euro.
The idea is thus to combine several linear models to get a more sensible prediction. This can be done using regression splines, for which the parameters are chosen using cross-validation.

On number of ways, this model is much more satisfying than the first one. Regarding the large values of number of goals scored, the above plots show that our model is now able to predict them 🙂
Simulations and results
Our model gives us expected values for number of goals scored and against, as well as a model variance. We then simulate the number of goals with normal error around the expected value. We do this 10000 times for each match and finally get Monte-Carlo probabilities for the outcome of each group phase match, as well as odds for each team to end at each place in its group and to qualify to each round of the knockout phase.
The results can be found here, and I will post another article later to comment them (which really is the fun part after all!).