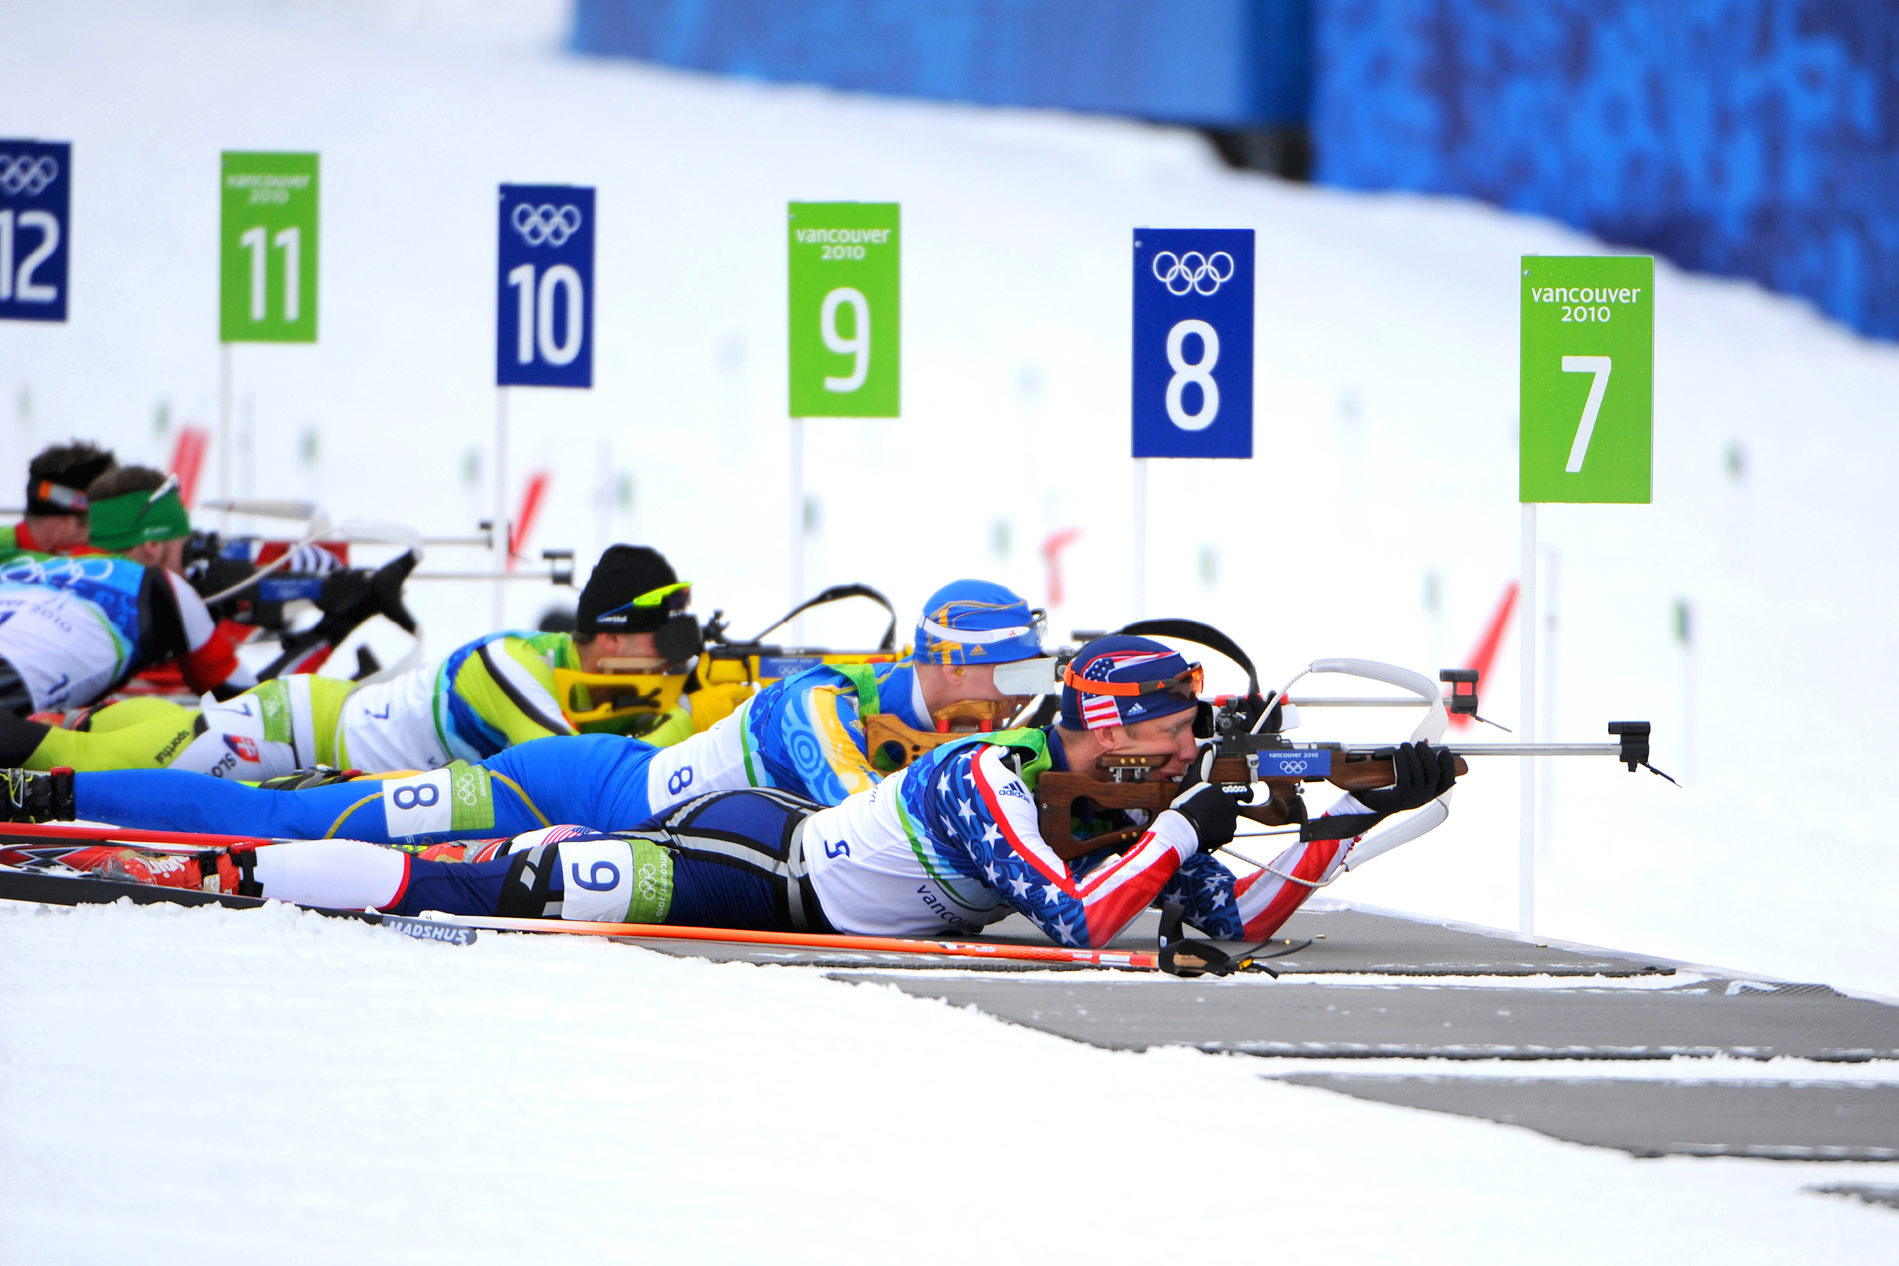
[Sports] Don’t miss a shot in biathlon races

Today, I want to speak about my favorite sport to watch on TV, which is biathlon (the one which involves skiing and shooting at things. Who doesn’t love that?). I really enjoy to follow the races, and not only because the best athlete at this moment is a french one (go Martin!), but because the shooting part seems so crucial and stressful. This leads me to wonder about how much missing a shot is relevant for the ranking in the end of the race. Let’s find out!

Shoot

Gathering some data

My idea is to do some basic analysis on data about the results of many biathlon races, in order to evaluate if there is some form of correlation between the final ranking and the number of shot missed. This requires to first gather the data. The results are stored on multiple sites: obviously Wikipedia pages of the championships, but this website is much more detailed. I’m going to use some of the results between 2007 and 2015. I won’t use all of the races because I want to have comparable results: I’m going to only consider the races where the number of competitors is between 50 and 60. This allows me to interpret the results about final ranking with a similar scaling system for all the races. Moreover, the specificity of biathlon is that the rules are very different from a format to another (see this Wikipedia article for more informations), and I can’t easily discriminate my data between them. Using a limitation on the number of participants is a way to limit the width of the spectrum of formats considered. Well, let’s forget these technicalities and analyse the data!

Don’t miss a shot!

So, the idea is to put in regard the number of shots missed and the final ranking. Fun fact: the number of shot during a race is 20, but the maximum number of shot missed during a race I analysed is only 9. That’s not really a surprise if you frequently watch biathlon, because missing that much shots usually means that you’re going to finish in last place. I’m going to use a heat map in order to show the correlation. An heat map is a form of 2D data vizualisation which is based on a spectrum of colors. Thedarker the color is, the more important the value is. The idea here is to put in rows the final ranking, and in columns the number of shots missed. Here is what we obtain:

Miss a shot

There results directly show that:

  • There is a clear diagonal on the heat map. This isn’t really surprising: that means that everytime an athlete misses a shot, his final ranking goes lower. This is our first result: missing shot are penalties. What a surprise!
  • There is also a very dark blue area in the first column, at the top of the diagram. This means that most of the time, doing a clear round leads to a very good ranking in the end.
  • But it is clearly possible to win a race while missing some shots! The first row is filled with dark blue in the first few columns.

Don’t miss a prone shot!

As you may know, there is two different types of shooting during a biathlon race: the prone shot, where the athletes are lying on the floor; this position helps them to stabilise their aim. The other type is the standing shot, which is much more difficult. Therefore, it might be interesting to deal with the two phases of shooting separately. Let’s start with the prone shot, as this is usually the first phase of shooting during a race.

Prone shot

We see the same pattern as the total of shots. The top of the first column is much darker than before: this is because of two things. First, it is usual that a lot of athletes don’t miss a shot during the prone shot phase. And that means that missing a prone shot is much more a sign of a bad shooting, which leads to a bad ranking at the end. This point is very important: we’re not evaluating results in a vacuum: and missing a shot usually means that the athlete is in a bad shape compared to the others, and therefore has a bad ranking. But this also means that missing a shot during the first phase raise the odds of missing shots during the other phases.

Let’s have a look at the heat map for the standing shots.

Standing shot

As expected (because the initial one is the combinaison of these two heatmap), we’ve a much more dispersed heat map. Missing a standing shot is something that happens to pretty much everyone, even the best athletes.

Is the starting order relevant?

I add to the analysis a last factor: the starting order, which is linked to the expectation of results of the athlete (based on a global ranking, or on the results of another race). The heat map showing the correspondances bewteen the final ranking (still in rows) and the starting order (in columns) shows a clear diagonal line: the expectation seems relevant.

Starting order

In order to do a much more indepth analysis, I’m going to perform a linear regression on these variables. I want to know if the final ranking is explained by the initial order, the number of prone shots missed and the number of standing shots missed. This linear regression will also help me to evaluate how big of an impact these three variables have on the final outcome. Let’s have a look at the results:

Call:
lm(formula = ranking ~ prone shots  + standing shots + starting order)

Residuals:
    Min      1Q  Median      3Q     Max 
-60.625  -8.483  -0.101   9.268  45.295 

Coefficients:
                  Estimate  Std. Error  t value   Pr(>|t|)    
(Intercept)       5.816571   0.212517   27.37

The three variables of the model are statistically significant, which means that they do have a relation with the final ranking. Understanding the coefficient for the Starting Order is kind of tough, but the two other coefficients are much more easier to analyse:

  • When you miss a prone shot, you lose about 5 places at the end of the race
  • When you miss a standing shot, you lose about 1 place at the end of the race

Obviously, these results are only valid on average. But this is kind of a fun way to comment biathlon shootings! “Oh, you just lost 10 places!”.