There are many things I don’t like with so-called math reasoning and lotteries, and I wanted to write about it for a very long time. So, on the one hand we have the classic scammers who try to sell you the “most probable numbers” (or alternatively the “numbers that are due”). Of course, neither strategy is mathematically valid (because the draws are independent). On the other hand, many “educated” and “rational” people argue that, given that the expected value of a lottery ticket is negative (because the probability of wining a prize at the lottery is very low), smart people should never buy lottery tickets.

Now what if we could find a (mathematically correct!) strategy to make the expected value of our ticket positive? The idea is to choose the numbers that other players choose the least often, so that when we win a prize, it will be divided among fewer other players. But will it be enough to make a significant difference?
The example
Let’s consider a lottery where players have to choose 6 numbers out of 19. The total number of players is 10000. The favorite numbers of the players are 1, 2, 3, 4, 5 and the least favorite are 15, 16, 17, 18, 19. They are respectively selected 2 times more often and 2 times less often than the other numbers 6 – 14. The company who runs the lottery decides to give the players back 90 percent of the amount of the tickets (thus ensuring a 10% profit) depending on the number of numbers they have chosen that also are in the right combination:
- 0 or 1 correct number: 0%
- 2 correct numbers: 42%, shared with other winners
- 3 correct numbers: 10%, shared with other winners
- 4 correct numbers: 3%, shared with other winners
- 5 correct numbers: 4%, shared with other winners
- 6 correct numbers (the jackpot): 40%, shared with (the eventual) other winners
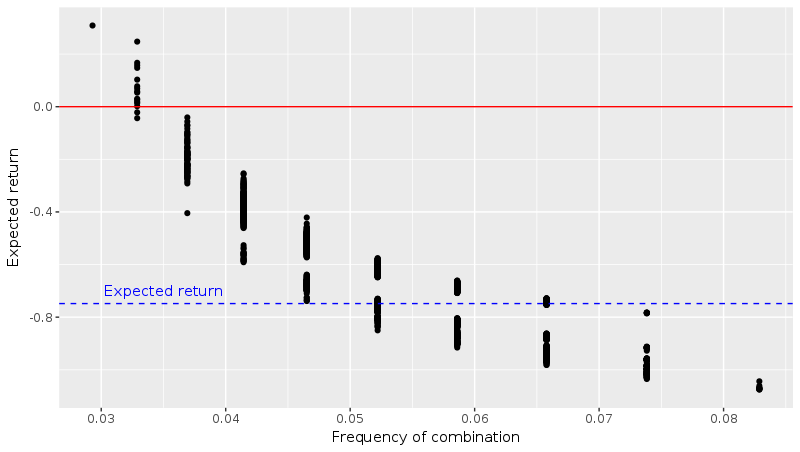
Then we compute the expected value for each ticket that was bought. You can find the R code I used on my GitHub page. I plotted the expected gains against an indicator of the rarity of the combination chosen by each player (the harmonic mean of the inclusion probabilities):

As we predicted, the expected gains are higher if you chose an “unpopular” combination. But what impresses me most is the order of magnitude of the effect. It is indeed possible to find a combination that yields a positive expected value (points on the left that are above the red line)!
Further work
I have no idea how all this works when we change the parameters of the problem: numbers to choose from (49 in France for example), number of players, choices of the players (inclusion probabilities of the numbers), payoffs, etc. I bet that the shape of the curve remains the same, but I wonder how high the expected value can get for the rarest combinations, and if it is always possible to find a winning strategy. I might try to work on an analytical solution when I find some time because I believe it involves some sampling theory.
Finally, a question to all people who never play the lottery because the expected value is negative, would you start buying tickets now that you know there exists a strategy with positive expected value?

PS: Henri pointed out chapter 11 of Jordan Ellenberg’s “How not to be wrong” which deals with interesting mathematical facts about the lottery, including a similar discussion as this post. Be sure to check it out, it’s really great!

