[Geekery] Dodging 9s

Today I found via FiveThirtyEight a riddle about arithmetic progressions: it’s called “Dodging 9s”. The question is to find the longest arithmetic progression (which means a collection of numbers in which each number is equal to the precedent plus some constant number (called the common difference), for instance 4 7 10 13 16) in which there is no 9 in any number. The repartition of the integers which contain a 9 is shown in the following figure, where the first row is 1 to 100, the second 101 to 200 and the last 9 901 to 10 000.

This repartition leads me to think that the progression must be built around the idea that it should avoid the black areas by making a “jump” over the portion of the integers which contains a 9. For instance, the progression 8 32 56 80 104 128 152 176 200 224 248 272 avoids the 90s and the 190s (but not the 290s, sadly). In order to determine the best progression, I will use R to calculate the length of the acceptable progression for multiple starting points and common difference. The following functions use regex in order to compute the length of the longest acceptable progression with these parameters:

nine  0) {return(1)}
  else {return(0)}
}

progression_length

Using this function on values bewteen 1 and 10 000 for the starting point and the common difference of the progression allows us to determine the maximum length achievable (within these parameters!). It appears that the longest one is the progression starting at 1 with a common difference of 125, which is :

1  126  251  376  501  626  751  876 1001 1126 1251 1376 1501 1626 1751 1876 2001 2126 2251 2376 2501 2626 2751 2876
3001 3126 3251 3376 3501 3626 3751 3876 4001 4126 4251 4376 4501 4626 4751 4876 5001 5126 5251 5376 5501 5626 5751 5876
6001 6126 6251 6376 6501 6626 6751 6876 7001 7126 7251 7376 7501 7626 7751 7876 8001 8126 8251 8376 8501 8626 8751 8876

and which is represented in the following graph by the grey tiles:

Adding one more term to the progression leads to 9001, which obviously contains a 9. This little exploration is of course no proof of any maximum length, but it shows that my hypothesis of some “jumps” over the 9 areas wasn’t wrong!

[Sports] What the splines model for UEFA Euro 2016 got right and wrong

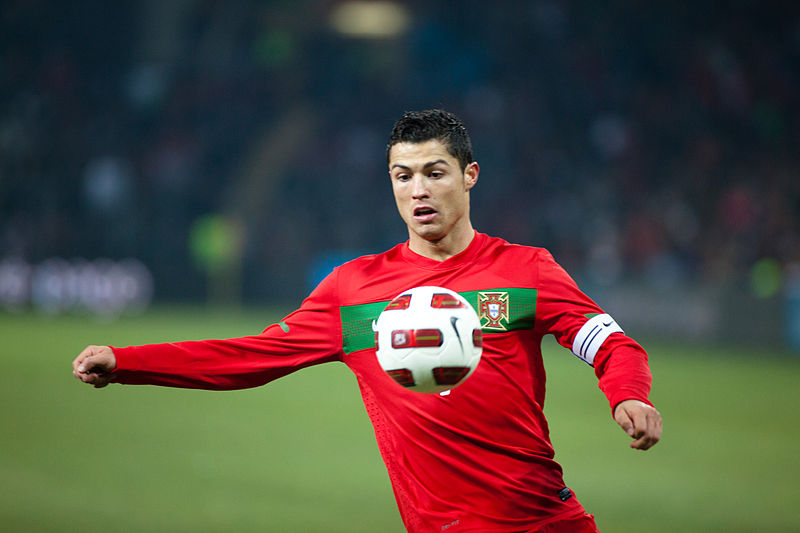
UEFA Euro 2016 is over! After France’s heartbreaking loss to Portugal in the Final, it’s now time to assess the performance of our “splines model“. On the main page of the project you can now find the initial predictions we made before the start on our competition. I also added a link to the archives of the odds we updated after each day (EDIT: I realize I made a mistake with a match that was played on Day 2, I’ll correct this asap – results should not be altered much though.)

screenshot Euro 2016
Screenshot predictions Euro 2016

What went well (Portugal, Hungary, Sweden)

Let’s begin with our new European champions: Portugal. They were our 5th favorite, with an estimated 8.3% chance of winning the title. To everyone’s surprise (including ours to be honest 😉 ), they finished 3rd in group F. However, the odds of this happening were estimated at 20%, so we can hardly say the splines model was completely stunned by this outcome! In fact, except for the initial draw against Iceland, we had all calls correct for Portugal games!

Hungary were described by some as the weakest team of the tournament, so by extension as the weakest team of group F. But they won it! Our model didn’t agree with those pundits, estimating the chances of advancing to the second round for Gábor Király‘s teammates at almost 3 out of 4.

Sweden certainly had one of the best players in the world with Zlatan Ibrahimovic. But our model was never a fan of their squad, and they did end up at the last place in group E. Similarly, Ukraine was often referred to as a potential second-rounder but ended up at the last place (losing all their games), which was the most likely outcome according to the splines model.

What went wrong (Iceland, Austria, England)

Austria were seen by the splines model as outsiders for this competition (4.7% of becoming champs – for instance, Italy’s chances were estimated at 4.2%). We evaluated their chances of advancing to the second round to be greater than 70%. They ended up at the last place of Group F with a single point.

On the contrary, Iceland were seen as one of the weakest teams of the competition and a clear favorite for last place in Group F. Eventually, they were astonishingly successful! On their way to the quarter-finals, they eliminated England. Our model gave England a good 85% probability to win the match. But, surprising as it was, this alone does not prove our model was not reliable (more on upsets on the next paragraph). Yet we can’t consider the projections for the Three Lions other than a failure, because they also ended up second in group B when we thought they would easily win the group.

Spain lost in round of 16 to Italy and in the group phase to Croatia. The estimated probabilities for these events were 40% and 16%.

Hard to say

We almsot included Turkey in the previous paragraph: after all, we gave them the same chances as Italy for winning the tournament, and we estimated their odds of advancing to the round of 16 to more than 70%, yet they failed. In addition, their level was described by experts as rather poor. But paradoxically, the splines model had all calls correct for Turkey games! What doomed them was the 3-0 loss against the defending champions, Spain. With a final goal average of -2 and 3 points, they couldn’t reach the second round as one of the four best thirds.

Wales unexpectedly beat Belgium, one of our favorites, in quarter-finals. But is this a sign of a bad model or bad luck? Upsets happen, and they’re not necessarily a sign that a team’s strength was incorrectly estimated.

Home field advantage

Our model stood out from others (examples here, here or here) on predictions for France. As a matter of fact, it valued much less home field advantage than the other models. But France didn’t win the Euro! Similarly, nearly all models predicted a Brazil victory in World Cup 2014, mostly because of home field advantage… and we all know what happened!

To us, it is unclear whether home field advantage during Euro or the World Cup can compare to home field advantage for a friendly match or a qualifier. I hope someone studies this particular point in the future!

Conclusion

We had a lot of fun building this model and it helped us enjoy the competition! I hope you guys enjoyed it too!