We’re now in the midst of the winter (at least in the northern hemisphere). Our Parisian winter, although not very cold, is quite rainy and cloudy, and it always depresses me a little no to see the sun for several days… Fortunately, at this the time of the year, every next day we can experience more daylight, reminding us we’ve never been closer to the next summer! This made me wonder: when does the length of day increase the most? My plan was to find out which day of winter it happened, and make it my own holiday, which I would celebrate by opening a bottle of Côte Rotie 2003 I was sparing for a special occasion.
Before I went on with the math, I told a few friends about my question, and they all told me they thought the day when day length increases the most would likely be the vernal equinox. But it didn’t seem that obvious to me! Sure, on March the 21st, the length of daytime will be equal everywhere on our planet, but that does not mean it has to be the same day that day length increases the most, does it? Let’s see who’s right!
Let’s do math!
As I’m not a physicist, I need an equation describing the length of daytime with respect to some parameters (including, hopefully, the latitude of the city where I live!). Fortunately, Robert Ferreol has already done a great job finding such an equation. For latitudes below the arctic circle (which is approximately 66.566667°), day length writes, in hours:
\(D = \frac{24}{\pi} \arccos \left( – \tan \lambda \cdot \tan \left( \arcsin \left( \sin \delta \cdot \cos \left( \frac{2\pi}{365} (r-172) \right) \right) \right) \right)\)
with:
\(\begin{align*}\lambda &= \text{latitude} \\
\delta &= \text{Earth axial’s tilt} \\
r &= \text{day of the year, } \in [0,365]
\end{align*}\)
Sure, this equation is a tad complicated, by it doesn’t really matter if your trigonometry lessons seem a bit far, you just need to know how to read simple graphs to understand what follows.
We can plot the day length function, for example for Paris (latitude: 48.8567°).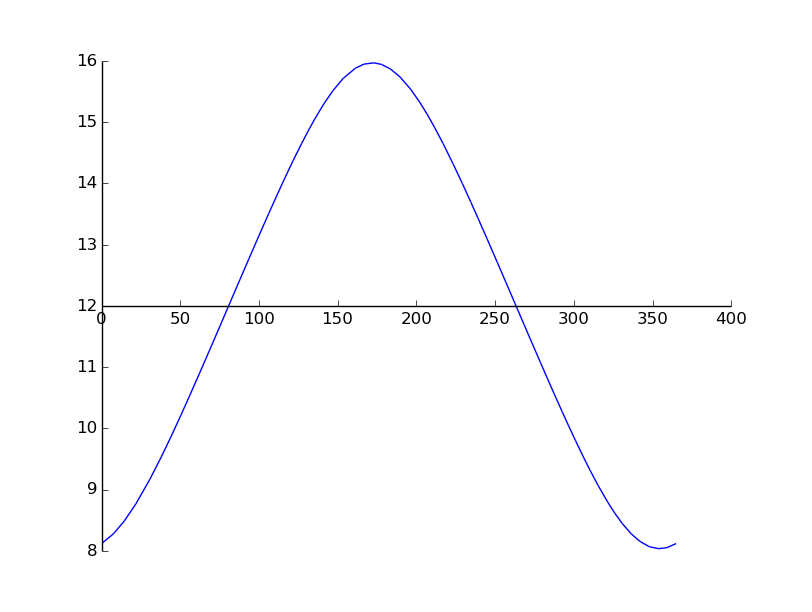
I’m quite satisfied with this graph: maximum happens around day number 172, which happens to be the summer solstice, and minimum happens around day number 355, which is December 21st, aka the winter solstice. We can also read from our graph that day length on day number 1 (January 1st) is a little more than 8 hours, which matches this more precise time table.
We can also plot our equation for different latitudes. For example, at the equator (latitude 0°), we have:
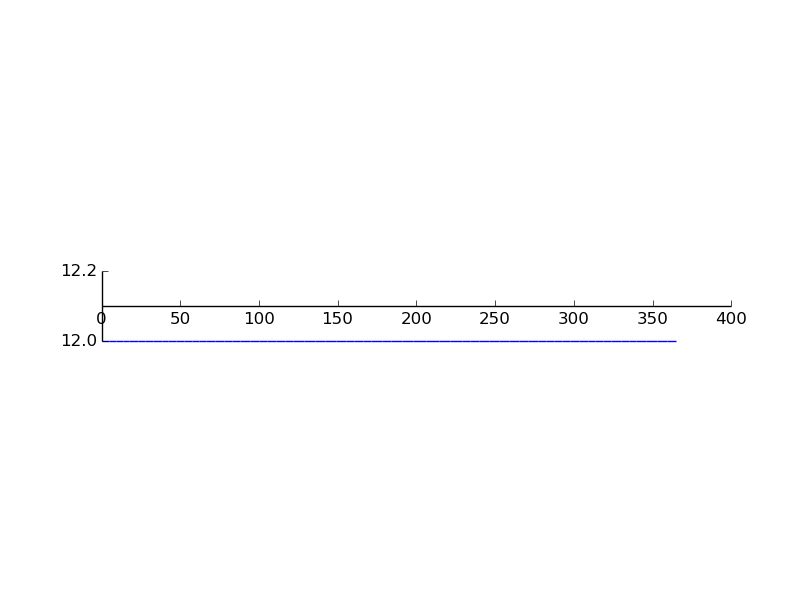
Again, this is what we expected, as day length when you’re located on the equator is the same across the year.
Studying the derivative
Great, it seems that we now have a nice equation describing day length with good accuracy. But, what we really want is the variations of day length. In math terms, it means we want to study the derivative of the day length function. Sure, I could compute the derivative by hand, but I am a little lazy (and with a function this ugly, it’s very likely that I would have to start over a few times before getting it right), so I’m going to ask my computer to do it instead. This is called symbolic computation. People in science usually use software like Maple or Mupad, but they’re expensive non-free software, and anyway I have a huge crush on Python, so I will use the excellent Sympy:
import math
from sympy import *
from sympy.plotting import *

r = symbols('r') # This is the variable of my function
lat = math.radians(48.8567) # Paris
delta = math.radians(23.4373408135) # Earth's axial tilt

lengthDay = 24/(math.pi) * acos(-tan(lat) * tan( asin( sin(delta) * cos(2*(math.pi)/365*(r-172)) ) ) )

# Compute the derivative
dLengthDay = diff(lengthDay, r)

print dLengthDay # We print the analytical form of the derivative (...it is as complicated as expected!)
plot(dLengthDay, (r, 0, 365))
I’m not really interested in the closed form of the derivative, but the plot should be very informative. In fact, for Paris, it gives:
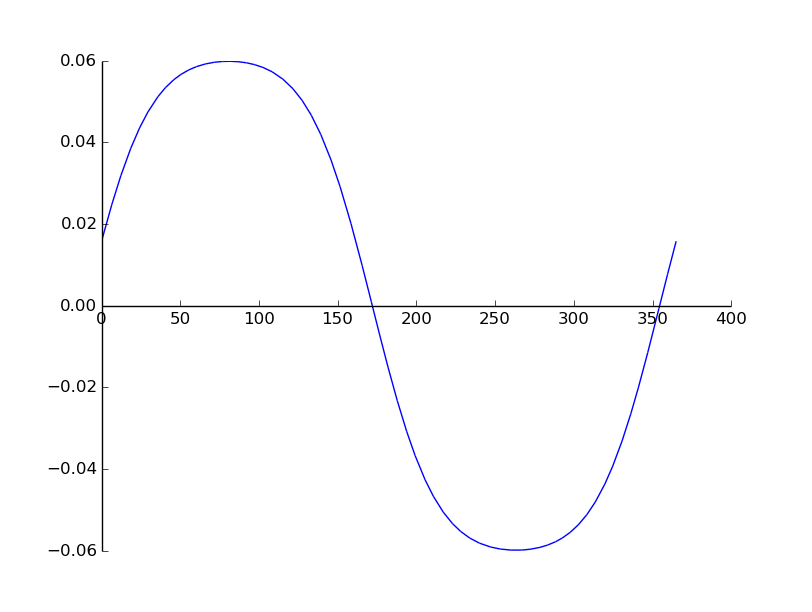
So, what is happening here? If you remember your calculus lessons correctly, when the derivative is greater than 0, the function increases, and when it’s lesser than 0, the function decreases. So it’s not a big surprise to see that the derivative is above the x’s axis before r = 172 (the summer solstice), and below the x’s axis between r = 172 and r = 355 (ie between the two solstices). In general, the value of the derivative gives the rate at which the function increases, which means the day we’re looking for has to be the one where the maximum of the derivative happens. In our graph, it seems to be around r = 80, but it’s not very easy to identify a clear maximum graphically. So, what is the best method to compute the maximum of a smooth function like this one? Yep, we derive it (yet again you might add. To be more specific, the day when day length increases the most is called an inflection point, which is when the second derivative equals 0).
# Second derivative
d2LengthDay = diff(dLengthDay, r)
print d2LengthDay
plot(d2LengthDay, (r, 0, 365))
The plot of the second derivative for Paris is:
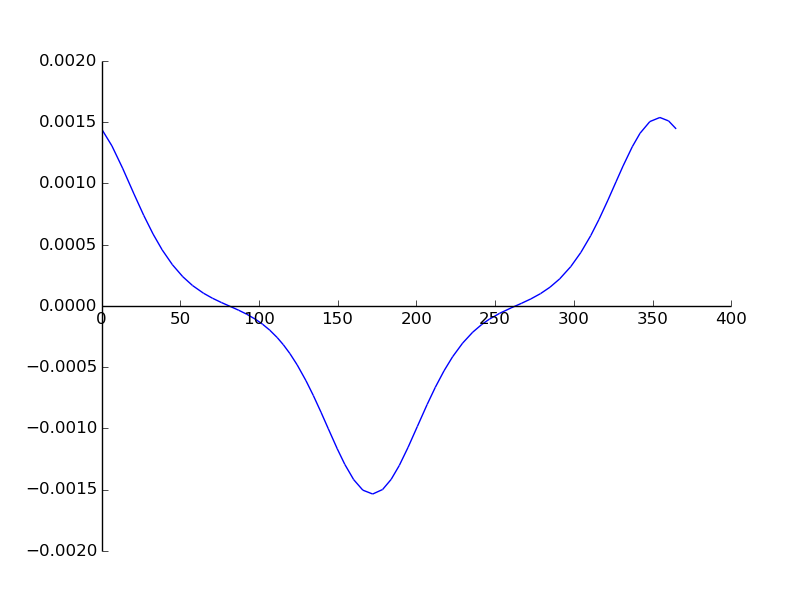
To identify the day when the derivative is zero, we can do it numerically with a Newton method (seeded with r=80, which visually seems to be a good approximation of the zero):
print nsolve(d2LengthDay, 80)
The nsolve returns:
80.7499999999996
Now it’s clear that our maximum is unique, and happens around day number 80(*), which is… March 21st, the vernal equinox! Darn, it seems my friends were right!
(*) If you wonder why I turn 80.749999 into “day number 80” and not “day number 81”, check out the last paragraph of this post.
Wait a minute, what about other latitudes?
I was not entirely satisfied with this answer, so I started making tests for other latitudes. The shape of the derivative was very similar to the one I got with Paris, until I started tests with northern latitudes. For example, at 63.5°N, we get:
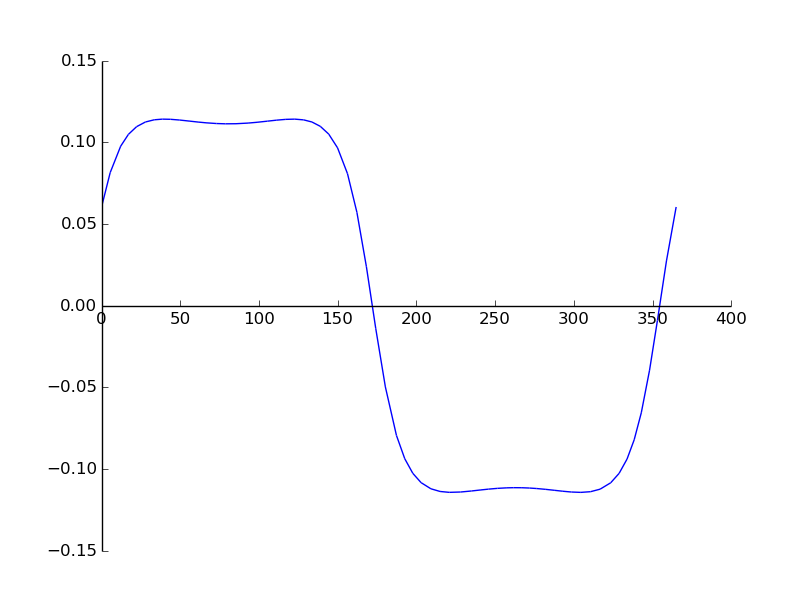
What does this graph mean? It appears that: for r = 80 (spring equinox), we now have a local minimum of the derivative instead of the maximum we had in Paris. The are now two local maxima, one happening between winter and spring, and the other one happening between spring and summer.
We can check this by plotting the second derivative: if we’re right, it will show three zeros between r=1 and r=172:
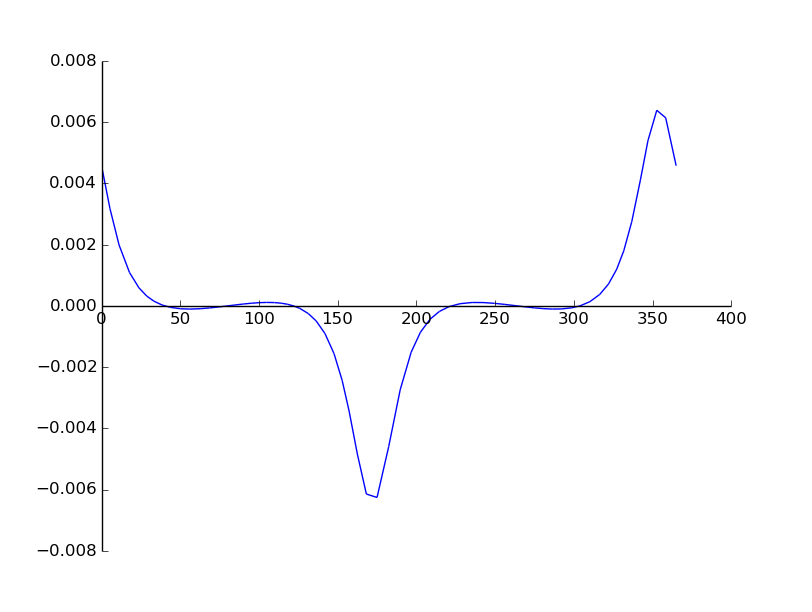
So it seems we were right! Zeros seem to be around 40, 80 and 120. But we can compute the dates of these zeros more precisely. For example, for Fairbanks, Alaska (latitude = 64.843611°), we write:
print nsolve(d2LengthDay, 50)
print nsolve(d2LengthDay, 80)
print nsolve(d2LengthDay, 120)
and get:
39.8279585264938
80.7499999999996
121.672041473505
The first one (r approximately equals 40), means that February, 9th is (one of) the inflection points we were looking for. To ensure that my equation was accurate enough, I compared my result with an astronomical time table. If you look at the “daylength” column, you will see that March 21st is indeed a local minimum, and that there are two local maxima for day length.
Computing the limit latitude
After a few tests, I started realizing that for very latitude above approximately 62°N, there were always two maxima, whereas for every latitude below, the only maximum that existed was around spring. This probably means that there exists a limit latitude, above which there are always two maxima, and below which always only one.
To compute (numerically) the limit latitude, we can write a quick and simple binary search:
def searchLimitLatitude(lat, count=0, lastBelow = 0, lastAbove = math.radians(66.56278), latBackup = lat):

	print "Test for latitude = ", math.degrees(lat)
	print "Iteration number: ", count

	lengthDay = 24/(math.pi) * acos(-tan(lat) * tan( asin( sin(delta) * cos(2*(math.pi)/365*(r-172)) ) ) )
	dLengthDay = diff(lengthDay, r)
	d2LengthDay = diff(dLengthDay, r)

	# How many distinct maxima are there?
	max1 = nsolve(d2LengthDay, 50)
	max2 = nsolve(d2LengthDay, 80)

	if(count >=1 and math.fabs(lat - latBackup) <= 1e-7 ): # we ask for 7-digit precision
		print "Finished, limit latitude is: ", math.degrees(lat)
		return lat

	if( math.fabs(max1 - max2) <= 1e-16 ):
		searchLimitLatitude(0.5 * (lastAbove + lat), count+1, lat, lastAbove, lat)
	else:
		searchLimitLatitude(0.5 * (lastBelow + lat), count+1, lastBelow, lat, lat)

print "Search limit latitude...."
lat = math.radians(50) # Initialization
searchLimitLatitude(lat)
Running this program gives:
Iteration number:  22
Finished, limit latitude is:  61.2497155042
As expected, the binary search converged very quickly (just 22 iterations to give a latitude precise within 7 digits!). Finally, we have a value for our limit latitude:
which, according to wikipedia, is just above Anchorage, Alaska and slightly below Tampere, Finland
Conclusion
My friends were partly right: I won’t be able to act snob and celebrate my own holiday. In fact, where I live (Paris, France), inflection point happens on the spring equinox, which many cultures have already been celebrating for centuries.
But, if you live in Fairbanks, Alaska, I suggest you call your boss to let him know you won’t be coming to work on February, 9th (which happens to be the day this is posted!);)
A few more precisions
You might wonder why when we found an inflection point on date 80.74999 for Paris, I said the corresponding day was #80 (March 21st), and when we found 39.8279 for Fairbanks, I said the corresponding day was #40. In fact, we reach here the limits of our simplified equation. One of the assumptions we made was to consider that the Sun was located at infinite distance from Earth (ie that the Sun was just a tiny point in the sky). Of course, this is not true, and it can lead to small errors if we stick to our equation. For example, on the vernal equinox at the North Pole, day length is really about 6 minutes longer than our equation predicts. In order to decide which day was really the day of the maximum increase in day length, I had to “cheat” a little (because I needed a more precise equation) by checking an astronomical table for these locations.
Something also worth noting is that there is also a slight modification of Earth’s tilt axis every year, which means the second derivative (and thus the inflection point) also changes every year. I don’t really have time for more than a few tests, but location of the inflection point seems to be very sensitive the parameters of the equation. This means that inflection point in Fairbanks could happen on very different dates each year.
EDIT : As Boris pointed out in the comments, I could have dealt with my problem more simply, by writing day length as a discrete series of 365 days, instead of deriving a continuuous function. With the continuuous method, day number “39.9” doesn’t make much sense, and I couldn’t decide whether it was February, 8th (#39) or February, 9th (#40). Using finite sequences, I needn’t have used the astronomical table for Fairbanks, for the day I was looking for would just have been the max of the delta series.


Hi Antoine!
I just read your article and found it cool and interesting. However, I do have some fundamental issues regarding the math that I cannot keep for myself 🙂 You are using continuous calculus, i.e., use function derivatives, where it doesn’t make much sense. The equation you are starting with has r in [0,365], but more importantly r in N. Taking, e.g., r = 1.5 does not make sense, as "the length of the 1.5th day" is not defined.
So in fact, what you want to compute is the maximum of a finite sequence (well, the maximum of the consecutive deltas of such sequence in your case), not the maximum of a continuous function. And it turns out that this is trivial to do! You didn’t have to go into all the derivative and root finding trouble: just compute all 365 values and see which one is the greatest! It’s much simpler and more mathematically correct. (and what you did anyway when "cheating" checking the astronomical table).
Anyway, nice analysis, and I’ve learned something. I really wouldn’t have expected those two maxima for northern latitudes.
Cheers!
Hi Boris,
That’s very true ! I guess I was too eager to use sympy ! I’ve edited the post to add your remark.
Thanks for sharing,
Antoine