I will be talking at CMStatistics on Monday, December 14 about how sampling methods can be used to estimate statistics on Twitter’s graph.
I will be talking at CMStatistics on Monday, December 14 about how sampling methods can be used to estimate statistics on Twitter’s graph.
Disclaimer : I don’t pretend to be a pro rider nor a sport doctor/physiologist, just a data scientist who sometimes likes to apply mathematical modeling to understand some real-world situations 🙂
I’m a bike enthusiast and I used to race (although I was far from being a champion!). I noticed during the training sessions among teammates that had approximately equivalent physical abilities than mine that our ways of performing were very different: every time we climbed a long steep hill, there was no way I could follow their pace no matter how hard I tried, but on the contrary, when I rode in front on a faux plat (especially when there was a lot of wind), I would sometimes find myself a few meters ahead of the pack without really noticing. In fact, I was physically quite different from the rest of the pack: my BMI is roughly equal to 23.5, whereas most of my training mates were in the low 19s.
Watching the pros compete, I found a somewhat similar pattern: although it’s very unlikely that we see a powerful sprinter such as André Greipel win the Flèche Wallonne someday at the famous and feared Wall of Huy ; however, the podium of the 2011 World championships in Copenhaguen was 100% “sprinters”, although the finish line was at the end of a slight slope (with a reasonable gradient of ~ 3%).
Based on these two examples, we can see that although very steep hills are obviously lightweight riders’ turf, more powerful (and thus, heavier) riders can still outperform them on slopes with low gradients. So, my intuition was that there exists a “limit gradient” after which the benefits of being powerful (which comes up with being heavier, given that riders have same physical abilities) are overrun by the benefits of being more lightweight, which gives an edge when you have to fight gravity. Are we going to be able to quantify such a limit ?
The power needed to move at speed v on a bike is sum of the power needed to move the air, the power needed to resist friction, and the power needed to resist gravity:
\(\begin{align*}
P &= P_{air} + P_{friction} + P_{gravity} \\
&= v \cdot \left( \dfrac{1}{2} \cdot \rho \cdot SC_X \cdot (v-v_{wind})^2 + Mg C_r \cos \phi + C_f (v-v_{wind})^2 + Mg \sin \phi \right) \\
\end{align*}\)
where:
\(\begin{align*}
\rho &= \text{Cubic mass of air} \\
SC_X &= \text{Drag coefficient} \\
C_r &= \text{Wheels coefficient} \\
C_f &= \text{Friction coefficient} \\
M &= \text{total weight rider + bike} \\
g &= 9.81 ms^{-2} \\
\phi &= \text{slope gradient} \\
v_{wind} &= \text{wind speed} \\
\end{align*}\)
The values chosen for the parameters can be found in the R code on my GitHub page.
This formula shows that the lighter you are, the less power you need to move at speed v. But let’s not forget that my hypothesis is precisely that if you are more powerful, you may be heavier but you’ll also be able to produce more power!
So now, I need a equation to relate mass and power for riders with similar abilities. One way to do this is to consider that physical abilities are measured by power divided by body mass (a measure that has been widely used and discussed recently). So this is going to be my first work hypothesis:
\(\begin{align*}
\text{H1: } \frac{P}{m} \text{ is constant among riders of the same level}
\end{align*}\)
Nevertheless, this doesn’t feel satisfying: sure, it is very common to assume a linear relationship between two parameters, but most of the time we do this because we lack of a better way to describe how things work. And in this case, it seems that power is linked to body weight by Kleiber’s law, which is going to be my second work hypothesis:
\(\begin{align*}
\text{H2: } {\left(\frac{P}{m}\right)}^{0.75} \text{ is constant among riders of the same level}
\end{align*}\)
Now, I need the value of the constants under hypotheses H1 and H2. For now, I’m only interested in top-level riders, so I choose to use Strava data for Robert Gesink on the wall of Huy to compute the constants under hypotheses H1 and H2. Turns out Gesink, who weighs 70kg, was able to develop a mean power of 557W during the climbing of the hill, which gives us our two constants:
\(\begin{align*}
C_{H1} &= \frac{557}{70} \\
C_{H2} &= {\left( \frac{557}{70} \right)}^{0.75} \\
\end{align*}\)
We are now able to plot the speed advantage that a rider weighing m2 would have over a rider m1 < m2, given that the two riders have similar physical abilities (e.g. same body fat mass). We could plot this function for any m1,m2 but I’m basically looking for a gradient that would equate chances for almost all professional riders, so I’m going to select m1 = 57kg (Joaquim Rodriguez) and m2 = 80kg (André Greipel) from the two most different riders I can think of. We get:
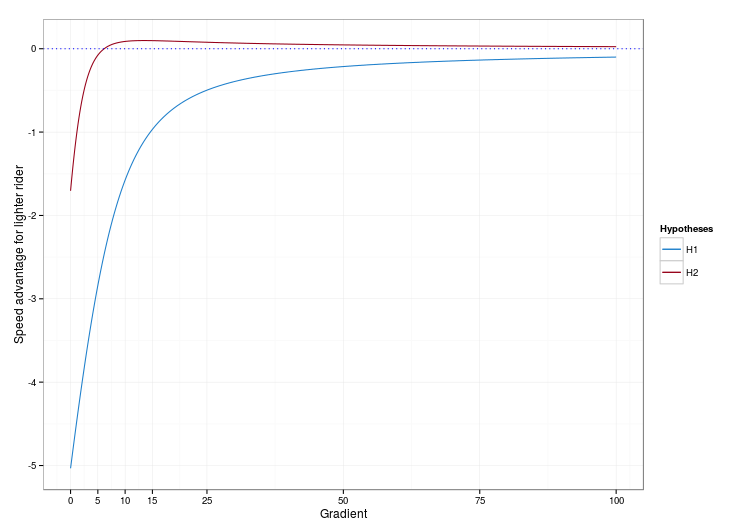
On this graph, we see that under hypothesis H1 (blue curve), the function giving the speed advantage for the lighter rider remains always negative, which means it is always better to be more powerful, even if you have to drag an additional charge while climbing (this is quite surprising, and I think we could use this result to dismiss H1… but a physiologist would qualify way more than me to discuss this particular point!). The curve we get under hypothesis H2 (red curve) is far more interesting. It shows that when the road is flat or faux plat, the more powerful rider has an edge, but for steep slopes (10% and more), the lighter the better. And it between, there exists a “limit gradient”, which confirms what I initially suspected. Yay!
The “limit gradient” appears to be between 5% and 10%. Now we can write a few lines of code (in R) to determine its exact value. We get:
gradient_lim ~ 6.15 %
According to our model, this means that if a race includes hill whose gradient is approximately 6%, Rodriguez and Greipel stand equal chances of being the fastest (and so probably all the riders in between these very different two champions). In particular, when the finish line of a race is drawn at the top of a climb, it could be really interesting to choose a 6% gradient: below, it would be typically a sprinters-type finish and above, a climbers-type finish. Incidentally, this happens to be roughly the gradient of the final hill of the 2015 World Championships held in Richmond this Sunday! Well done, Virginia!

If I want to do this analysis again for riders of my level, all I need to do is compute the constants according to my Strava data. Turns out on ~1.5 km hills, I can develop approximately 250W, and I weigh 70kg. I get:
gradient_lim ~ 4.9 %
Although it’s not very rigorous, I can confirm that of the (very) few KOMs/not-so-bad-performances I hold on Strava, all of them occurred on slopes with gradients lower than 4%.
Of course, I don’t pretend that the values for the “limit gradients” I find are an exact measure, and always should be the gradient of final hills on every race. For starters, there are a lot of parameters that I didn’t take into account :
– the length of the hill (I voluntarily did not say a word about the fact that different riders could react very differently to hills presenting the same gradient but different lengths)
– that top-level riders may not have exactly the same physical abilities (for example in terms of body fat percentage) when their riding styles are different
– that I’m not sure that Kleiber’s law is really valid in this context? From what I understand, it was primarily designed for evolutionary biology, not for physiology, but I couldn’t find better.
– and of course, that who wins a bike race depends more on the profile of the race before the final sprint, which after all is the very nature of this beautiful sport!
Still, I think we can reasonably assert that in general a 2-3 % gradient is not enough to discourage powerful riders from sprinting, and that a 8-9 % gradient largely favors the Rodriguez-like riders of the pack! And if anyone holds a dataset that could enable me to check this hypothesis, I’d be very happy!
We often hear the term “representative”, which supposedly assesses the quality of a sample. In this article, I’ll try to show you that not only “representative” has no scientific meaning, but also it is misleading, especially for people who are not survey sampling specialists. This includes students, researchers in social science who use surveys, journalists, etc. I hope I’ll convince you to never use it again !
I’ll try to make this post understandable even if you don’t know the basics of survey sampling theory. Well, you might miss a thing or two, but I think my main arguments are perfectly understandable to anyone who has ever taken a course in statistics. And perhaps I’ll write an article later to explain the basics of survey sampling in layman’s terms 😉
In this article, I’ll only speak about random sampling, which is the technique governments use to produce many official statistics. I will not speak about non-random methods like quota sampling or other techniques mostly used by market research companies.
Horvitz and Thompson provide us an unbiased estimator using sample data. Assuming you know \(\pi_k\), the inclusion probability of unit k, and you’re trying to measure the mean of \(Y\) using the \(y_k\) only known for units in the sample (s). The size of the sample is n, and the size of the population is N. Then the estimator:
is unbiased, as long as no inclusion probability equals 0.
The Horvitz-Thompson estimator can also be written:
which means units are weighted by the inverse of their inclusion probability.
As you can see from the formula, the Horvitz-Thompson estimator is very different from the sample mean (ie the plugin estimator), which writes:
This means that in general, if you estimate a mean by direclty using the sample mean, you end up with bias. I think that saying a randomly selected sample is “representative” of the studied population suggests that you could use the plugin estimator, no matter what the inclusion probabilities are. After all, if you claim your sample is somehow a valid “scale model” of the population, why couldn’t simple stats such as means, totals or even quantiles of variables of interest be directly inferred from the stats in the sample ?
The only case when the plugin estimator is unbiased is when all inclusion probabilities are equal. But with equal probabilities, rare characteristics are very unlikely to be selected which is (paradoxically) why you’ll very seldom hear someone use the term “representative” speaking of a sample selected with equal probabilities. Besides…
… you can obtain much better precision (or, alternatively, much lower costs) by using unequal inclusion probabilities. Stratified sampling and cluster/two-stage sampling are way more common than simple random sampling for this reason.
The most telling example is perhaps stratified sampling for business surveys. Imagine a business sector when you can regroup businesses into two groups. Your goal is to estimate the mean revenue, by sampling 100 units out of 1090. Key figures for the population of my example are gathered in the following table:
| Group | Revenue range (M$) | Dispersion of revenue | N |
| “Big” businesses | 50 – 50000 | 300 | 100 |
| “Small” businesses | 0 – 50 | 10 | 990 |
One of the best sampling designs you can use is stratified sampling (with a SRS in each stratum) using the optimal allocation. Neyman’s theorem gives the inclusion probabilities for the optimal allocation:
| Group | Inclusion probability for every unit in group |
| « Big » businesses | 75% |
| « Small » businesses | 2,5% |
Inclusion probabilities are way different between the two groups ! Another way to see this: one only sample cannot provide good estimates for every variable you could think of. In our example, optimal inclusion probabilities would certainly be very different if we tried to estimate (for example) the number of businesses that were created less than a year ago. The best expected precision for a variable depends on the sampling design. And to assess this expected precision, there’s no other choice than to think in terms of bias and variance. There are formulas for precision estimation, but “representativity” is by no means a statistical concept.
This point is directly related to the previous one: inclusion probabilities are designed to optimize the estimator of one variable (or possibly a few variables with high correlation). Neyman’s theorem also gives this optimal allocation, i.e. how you should divide your 100 sampled units between the two groups :
| Group | Share of the population | Share of the sample (optimal allocation) |
| « Big » businesses | 9,2% | 75% |
| « Small » businesses | 88,8% | 25% |
If you look at the final allocation, we have a huge over-representation of “big” businesses, in comparison of their relative number in the population. However, this is the optimal allocation, meaning that this sample will lead to the best possible estimator for revenue.
Consequently, the sample is not required to “look like” the population for the estimator to be good… in our example it is in fact quite the contrary !
Estimation in survey sampling can be somewhat counter-intuitive. If you want to be as rigorous as a statistician should be, think in statistical terms, such as bias and variance. And when you speak about survey sampling, ban words which have no statistical meaning, such as “representative” or “representativity”.
Pour changer un peu, aujourd’hui, un post écrit en français ! De temps à autres pendant mes congés, je prends le temps de regarder la célèbre émission “Des chiffres et des Lettres”. Je m’assois devant ma télévision avec une bonne tasse de thé bien chaud, du papier et un crayon pour compter les points, et je tente de terminer avec le score le moins éloigné possible du vainqueur du jour. Sur la partie “Le compte est bon” (les chiffres, donc), je crois m’en tirer honorablement. “Le mot le plus long” (les lettres) est pour moi un exercice beaucoup plus difficile ; il n’est pas rare que je n’aie rien à proposer, quand les candidats ont de leur côté trouvé le même “8 lettres” dont j’ignore la signification !
Bien que je n’aie que trop rarement l’occasion de regarder l’émission, il me semble que l’on retrouve assez souvent les mêmes mots parmi les solutions. De plus, certains mots rares semblent connus de beaucoup de candidats : si je comprends bien, il s’agit quand on s’entraîne de procéder un peu comme au Scrabble, en apprenant à reconnaître des types de combinaisons, et les listes de mots associés. Je me suis donc demandé si l’on pourrait construire des probabilités de tirage pour chaque mot, et en déduire la liste des mots les plus probables.
En cherchant sur les interwebs, je suis tombé sur beaucoup de solveurs “Le mot le plus long” programmés en javascript, quelques fanblogs avec des conseils pour joueurs en herbe, mais rien qui ne ressemble à un début de réponse à la question que je me posais (pour une analyse de la partie “Le compte est bon”, je vous renvoie à l’excellent post sur le blog Datagenetics).
Il s’agit donc de dresser une liste des mots valides dans le jeu, et de leur attribuer à chacun une probabilité de tirage. Intuitivement, cette probabilité de tirage doit prendre en compte la fréquence des lettres tirées par l’ordinateur de l’émission, ainsi que la fréquence d’occurrence des voyelles relativement aux consonnes.
En effet, si vous avez bien compris le principe de l’émission (sinon, rassurez-vous, vous n’êtes pas les seuls), chaque candidat choisit à tour de rôle “consonne” ou “voyelle”, et l’ordinateur tire ensuite une lettre correspondant au choix du candidat. Les choix des candidats doivent donc logiquement influencer la probabilité que l’on attribue à chaque mot.
Afin de ne pas trop surcharger ce post, je n’écrirai pas ici le code utilisé pour chaque étape. Mon programme est écrit en R, et je le mettrai probablement à disposition sur mon gitorious prochainement.
Pour commencer, nous avons bien entendu besoin d’un dictionnaire adapté, c’est-à-dire contenant uniquement les mots valides selon la règle du “mot le plus long”. Le dictionnaire Lexique contient des informations qui permettent d’identifier la nature grammaticale des mots, ce qui va nous permettre de retirer de la liste les mots interdits par le règlement. Le fichier contient également quelques informations utiles sur chaque mot (sa fréquence d’usage, par exemple), ce qui devrait nous permettre de faire quelques statistiques intéressantes. La dernière mise à jour du dictionnaire Lexique semble dater de 2007. Même si des mots apparaissent et disparaissent chaque année du dictionnaire, un intervalle de 7 ans me semble largement acceptable pour répondre à mes besoins.
Il faut ensuite trouver la probabilité d’appartition de chaque lettre, conditionnellement au choix “Voyelle” ou “Consonne”. Le règlement de l’émission n’est pas très explicite à ce sujet, et après une petite recherche google, il semble que personne ne connaisse réellement les probabilités de sélection des lettres. Qu’à cela ne tienne, nous allons les estimer à l’aide de la loi des grands nombres et d’une base de données ! Jacques Colard tient à jour sur sa page une base de données recensant tous les tirages depuis 1997. Ce travail très impressionnant nous sera également utile pour analyser les choix “voyelle” ou “consonne” des candidats. Le dernier changement dans les règles de jeu date de fin 2011. Afin d’éviter tout problème, mon étude porte sur toutes les émissions diffusées entre janvier 2012 et décembre 2014. Le nombre de tirages dans la base (4671) me semble largement suffisant pour obtenir une bonne précision sur les estimations qui m’intéressent.
Nous allons expliciter notre raisonnement à l’aide d’un exemple. Supposons que le jeu se joue avec 4 lettres, et que les candidats ont choisi “Consonne” – “Voyelle” – “Consonne” – “Voyelle” (que je note par le suite le pattern CVCV). Calculons la probabilité de sortie du mot “CAVE” avec ce choix. Commençons par les voyelles : A et E. Pour trouver la probabilité de sélection étant donné la probabilité d’apparition de A et E parmi les voyelles, on peut fonctionner avec un arbre de probabilités (la méthode qui est enseignée au lycée, il me semble) :
En suivant le chemin A, puis E, on obtient :
Mais nous aurions pu tout aussi bien choisir d’abord “E”, ensuite “A”, ce qui nous aurait donné un autre chemin à suivre dans l’arbre de probabilités. On a finalement :
On peut procéder exactement de même avec les consonnes, ce qui donne finalement :
Plus généralement, pour tout mot, la probabilité de présence étant donnée le pattern s’écrit :
avec :
Je ne détaille pas ici le calcul du nombre de permutations des lettres du mot, qui est un problème classique de combinatoire. Je précise simplement qu’il faut penser à prendre en compte le fait que permuter deux lettres identiques ne constitue pas une nouvelle permutation du mot (vous pouvez vous rendre ici pour une explication détaillée).
Il faut ensuite trouver à partir de la probabilité conditionnelle au pattern la probabilité générale sur tous les patterns. On considère que tous les patterns sont des événements disjoints, ce qui permet d’écrire :
| B | C | D | F | G | H | J | K | L | M | N | P | Q | R | S | T | V | W | X | Z | |
|---|---|---|---|---|---|---|---|---|---|---|---|---|---|---|---|---|---|---|---|---|
| N | 777 | 1664 | 1075 | 647 | 960 | 666 | 104 | 109 | 2094 | 1248 | 2901 | 1196 | 232 | 3562 | 4152 | 2846 | 479 | 32 | 197 | 98 |
| % | 0.031 | 0.0665 | 0.0429 | 0.0258 | 0.0383 | 0.0266 | 0.0042 | 0.0044 | 0.0836 | 0.0498 | 0.1159 | 0.0478 | 0.0093 | 0.1423 | 0.1658 | 0.1137 | 0.0191 | 0.0013 | 0.0079 | 0.0039 |
| A | E | I | O | U | Y | |
|---|---|---|---|---|---|---|
| N | 4097 | 8320 | 3849 | 2821 | 2267 | 317 |
| % | 0.1891 | 0.3839 | 0.1776 | 0.1302 | 0.1046 | 0.0146 |
La fréquence d’apparition de chaque voyelle (et de chaque consonne) est utilisée comme d’estimateur de la probabilité de tirage de chaque lettre. Comme attendu, les lettres rares (Y, Z, etc.) sont moins probables que les lettres courantes (A, E, S, etc.).
Mon idée était que les choix des candidats étaient différents suivant les lettres déjà tombées (imaginez un tirage où vous avez déjà obtenu Z,H,Y,U – je suppose que votre choix futur ne sera pas nécessairement le même que si vous avez obtenu E,R,S,A), mais les lettres dans la base semblent apparaître toujours dans le même ordre (à nombre de voyelles égal). La base a déjà dû être ordonnée, et je ne peux donc pas différencier les patterns par ordre d’apparition des voyelles et consonnes (bien que cela ne me semble pas être une approximation trop dramatique !). On s’aperçoit par contre que les fréquences ne sont pas du tout symétriques en nombre de voyelles et de consonnes :
| CVCVCVCCCC | CVCVCVCVCC | CVCVCVCVCV | VCVCVCVCVV | VCVCVCVVVV | VCVCVVVVVV | |
|---|---|---|---|---|---|---|
| N | 72.00 | 1805.00 | 2538.00 | 248.00 | 7.00 | 1.00 |
| % | 0.02 | 0.39 | 0.54 | 0.05 | 0.00 | 0.00 |
Note : cette façon de procéder suppose que les tirages sont effectués avec remise, ce qui ne semble pas vrai d’après le règlement de l’émission. On réalise donc en réalité une autre approximation. Cette approximation est potentiellement plus grave pour les lettres rares. En effet, supposons que l’on tire sans remise parmi 100 lettres, contenant 30 “E” et 2 “Z”. Si la première lettre tirée est un “E”, la probabilité de tirer un “E” en deuxième lettre est de 29/99 et la probabilité avec remise (celle que nous utilisons), est de 30/100, qui lui est pratiquement égal. Par contre, si l’on a tiré un “Z” en première lettre, la probabilité de tirer un “Z” en seconde lettre est de 1/99, qui est pratiquement deux fois inférieur à 2/100, la probabilité avec remise. Néanmoins, le nombre de mots avec deux “Z” dans le dictionnaire me semble suffisamment limité pour que l’on ne s’inquiète pas trop de cette approximation !
Les tirages où il existe un 10 lettres semblent assez peu communs dans l’émission. Dans une des dernières émissions que j’ai pu suivre, les présentateurs de l’émission ont signalé la rareté de l’événement en félicitant un candidat qui avait trouvé un mot de 10 lettres. Essayons d’estimer la probabilité de cet événement en utilisant notre table. On peut utiliser la formule suivante : Si les An sont des événements deux à deux incompatibles, on a :
En considérant l’union de tous les mots de 10 lettres, sont-ils deux-à-deux incompatibles ? Non, car des anagrammes peuvent coexister au sein d’un même tirage. Il suffit donc de retirer les anagrammes de notre dictionnaire, afin de pouvoir sommer les probabilités de chaque mot de 10 lettres pour obtenir la probabilité qu’il existe un 10 lettres dans le tirage. On obtient :
Une vérification sur la période 2012 – 2014 montre qu’il y a eu 120 tirages avec existence d’au moins un 10 lettres sur 4671 tirages dans notre base. Ce qui donne une fréquence de 2.57% : pas trop mal !
Pour donner un ordre de grandeur de cette probabilité : en partant d’une émission diffusée à un instant t, il y a presque 40% de chances qu’aucun 10 lettres ne sorte avant 40 tirages, c’est-à-dire presque 7 émissions.

Enfin, nous y voici ! Nous sommes désormais capables d’attribuer une probabilité à chaque mot valable pour “Le mot le plus long”. Le mot les plus probable est IE (qui est référencé comme nom dans le dictionnaire Lexique, mais n’est peut-être pas accepté par le dictionnaire de référence, étant une abréviation). Le deuxième mot le plus probable est “EU”, participe passé du verbe “avoir”.
Quelques mots ont une probabilité strictement nulle, car ils contiennent 2 voyelles et 7 ou 8 consonnes, patterns inexistants dans notre base 2012-2014, et donc réputés de probabilité nulle : BLANCSBECS, CULSBLANCS, FRANCFORTS, GRANDSDUCS, HALFTRACKS, NIGHTCLUBS, PLATSBORDS, SCHILLINGS, SCHTROUMPF, SCRATCHING,
SCRIPTGIRL, SHRAPNELLS, SPHINCTERS, SPRINKLERS, STRESSANTS, STRETCHING, TCHATCHANT, TRANCHANTS, TRANSCRITS, TRANSFERTS, TRANSPORTS, TREMBLANTS.
Le mot le moins probable à probabilité strictement positive est BOWWINDOWS. Sa probabilité vaut de l’ordre de 10^-15, ce qui signifie que l’on peut espérer le voir apparaître environ une fois toutes les… 26 000 milliards d’émissions !
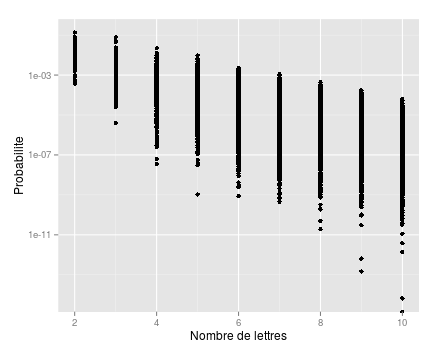
Comme on peut s’y attendre, la probabilité est fonction décroissante du nombre de lettres, comme le montre ce graphe en échelle logarithmique :
Je termine en donnant les mots les plus probables par nombre de lettres (de 6 à 10) :
| mot | probabilite (%) | anagrammes |
|---|---|---|
| AINEES | 0.22 | ANISEE |
| OISEAU | 0.21 | |
| AEREES | 0.20 | |
| AERIEN | 0.19 | ANERIE |
| SOIREE | 0.19 |
| mot | probabilite (%) | anagrammes |
|---|---|---|
| OSERAIE | 0.11 | |
| AERIENS | 0.10 | ANERIES |
| ATRESIE | 0.09 | |
| SATINEE | 0.08 | |
| REALISE | 0.07 | SALIERE |
| mot | probabilite (%) | anagrammes |
|---|---|---|
| ARTESIEN | 0.04 | TANIERES,TRAINEES |
| ARLESIEN | 0.03 | LANIERES |
| ALTIERES | 0.03 | ATELIERS,REALISTE,REALITES |
| RATISSEE | 0.03 | |
| EURASIEN | 0.03 | RAINEUSE |
| mot | probabilite (%) | anagrammes |
|---|---|---|
| INALTERES | 0.02 | RALENTIES |
| NOTARIEES | 0.02 | |
| INSTAUREE | 0.01 | |
| CARTESIEN | 0.01 | CERTAINES,SENATRICE |
| ENLIASSER | 0.01 |
| mot | probabilite (%) | anagrammes |
|---|---|---|
| ORIENTALES | 0.01 | ORLEANISTE |
| INALTEREES | 0.01 | |
| NEUTRALISE | 0.01 | RELUISANTE |
| INSTAUREES | 0.01 | TRAINEUSES |
| RATIONNEES | 0.01 |
Certains de ces mots m’étaient inconnus ou ne me seraient jamais venus à l’esprit dans le cadre du jeu (OSERAIE, ATRESIE, ENLIASSER, RAINEUSE, etc.) !
J’arrête ici ce post déjà bien long… mais je ne manque pas d’idée pour exploiter ma nouvelle base de données (que je vous livre en format texte csv) ! Je vous donne donc rendez-vous d’ici quelques jours pour la deuxième partie de cette analyse des mots les plus probables à “Des chiffres et des lettres”.
Télécharger la base des probabilités des mots
Image titre : logo “Des chiffres et des lettres”, © France 3
We’re now in the midst of the winter (at least in the northern hemisphere). Our Parisian winter, although not very cold, is quite rainy and cloudy, and it always depresses me a little no to see the sun for several days… Fortunately, at this the time of the year, every next day we can experience more daylight, reminding us we’ve never been closer to the next summer! This made me wonder: when does the length of day increase the most? My plan was to find out which day of winter it happened, and make it my own holiday, which I would celebrate by opening a bottle of Côte Rotie 2003 I was sparing for a special occasion.
Before I went on with the math, I told a few friends about my question, and they all told me they thought the day when day length increases the most would likely be the vernal equinox. But it didn’t seem that obvious to me! Sure, on March the 21st, the length of daytime will be equal everywhere on our planet, but that does not mean it has to be the same day that day length increases the most, does it? Let’s see who’s right!
As I’m not a physicist, I need an equation describing the length of daytime with respect to some parameters (including, hopefully, the latitude of the city where I live!). Fortunately, Robert Ferreol has already done a great job finding such an equation. For latitudes below the arctic circle (which is approximately 66.566667°), day length writes, in hours:
\(D = \frac{24}{\pi} \arccos \left( – \tan \lambda \cdot \tan \left( \arcsin \left( \sin \delta \cdot \cos \left( \frac{2\pi}{365} (r-172) \right) \right) \right) \right)\)
with:
\(\begin{align*}Sure, this equation is a tad complicated, by it doesn’t really matter if your trigonometry lessons seem a bit far, you just need to know how to read simple graphs to understand what follows.
We can plot the day length function, for example for Paris (latitude: 48.8567°).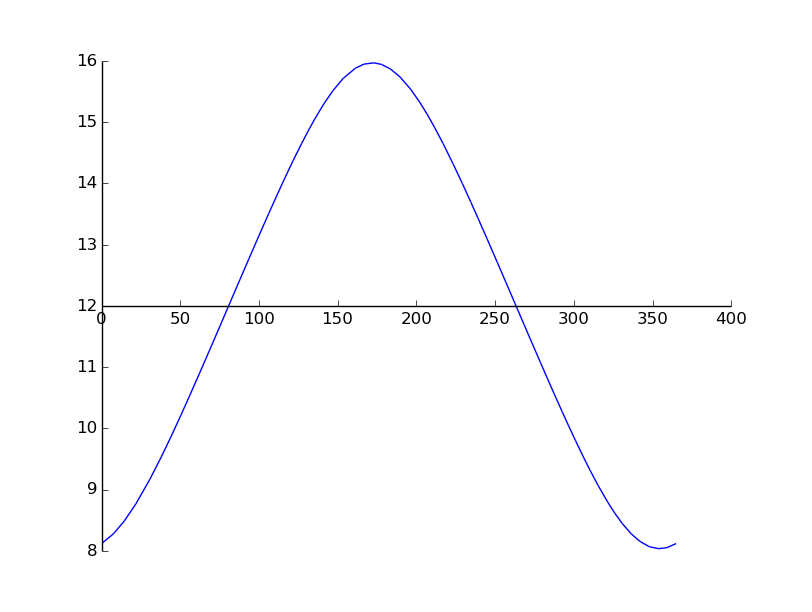
I’m quite satisfied with this graph: maximum happens around day number 172, which happens to be the summer solstice, and minimum happens around day number 355, which is December 21st, aka the winter solstice. We can also read from our graph that day length on day number 1 (January 1st) is a little more than 8 hours, which matches this more precise time table.
We can also plot our equation for different latitudes. For example, at the equator (latitude 0°), we have:
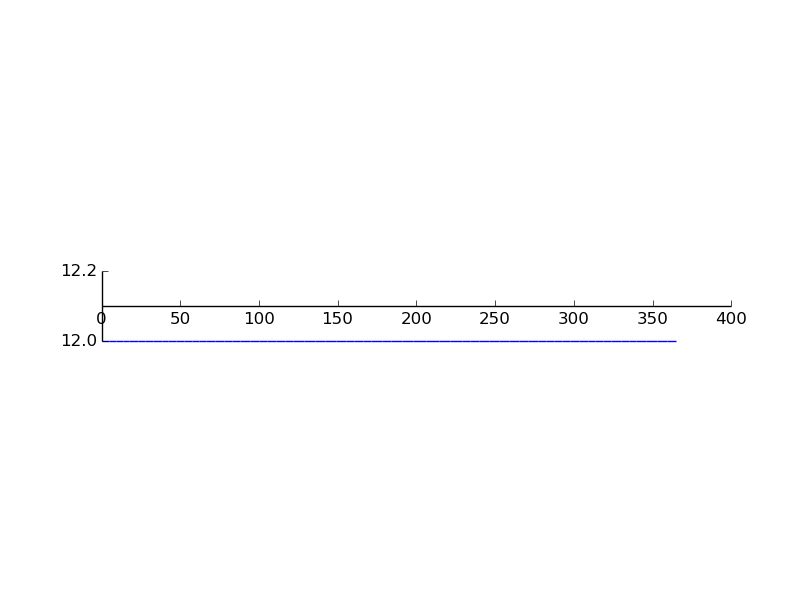
Again, this is what we expected, as day length when you’re located on the equator is the same across the year.
Great, it seems that we now have a nice equation describing day length with good accuracy. But, what we really want is the variations of day length. In math terms, it means we want to study the derivative of the day length function. Sure, I could compute the derivative by hand, but I am a little lazy (and with a function this ugly, it’s very likely that I would have to start over a few times before getting it right), so I’m going to ask my computer to do it instead. This is called symbolic computation. People in science usually use software like Maple or Mupad, but they’re expensive non-free software, and anyway I have a huge crush on Python, so I will use the excellent Sympy:
import math
from sympy import *
from sympy.plotting import *

r = symbols('r') # This is the variable of my function
lat = math.radians(48.8567) # Paris
delta = math.radians(23.4373408135) # Earth's axial tilt

lengthDay = 24/(math.pi) * acos(-tan(lat) * tan( asin( sin(delta) * cos(2*(math.pi)/365*(r-172)) ) ) )

# Compute the derivative
dLengthDay = diff(lengthDay, r)

print dLengthDay # We print the analytical form of the derivative (...it is as complicated as expected!)
plot(dLengthDay, (r, 0, 365))
I’m not really interested in the closed form of the derivative, but the plot should be very informative. In fact, for Paris, it gives:
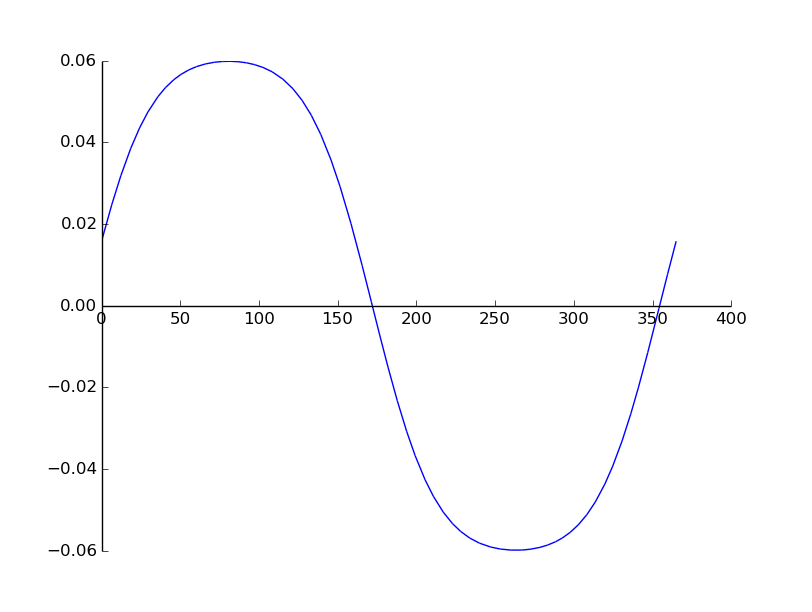
So, what is happening here? If you remember your calculus lessons correctly, when the derivative is greater than 0, the function increases, and when it’s lesser than 0, the function decreases. So it’s not a big surprise to see that the derivative is above the x’s axis before r = 172 (the summer solstice), and below the x’s axis between r = 172 and r = 355 (ie between the two solstices). In general, the value of the derivative gives the rate at which the function increases, which means the day we’re looking for has to be the one where the maximum of the derivative happens. In our graph, it seems to be around r = 80, but it’s not very easy to identify a clear maximum graphically. So, what is the best method to compute the maximum of a smooth function like this one? Yep, we derive it (yet again you might add. To be more specific, the day when day length increases the most is called an inflection point, which is when the second derivative equals 0).
# Second derivative
d2LengthDay = diff(dLengthDay, r)
print d2LengthDay
plot(d2LengthDay, (r, 0, 365))
The plot of the second derivative for Paris is:
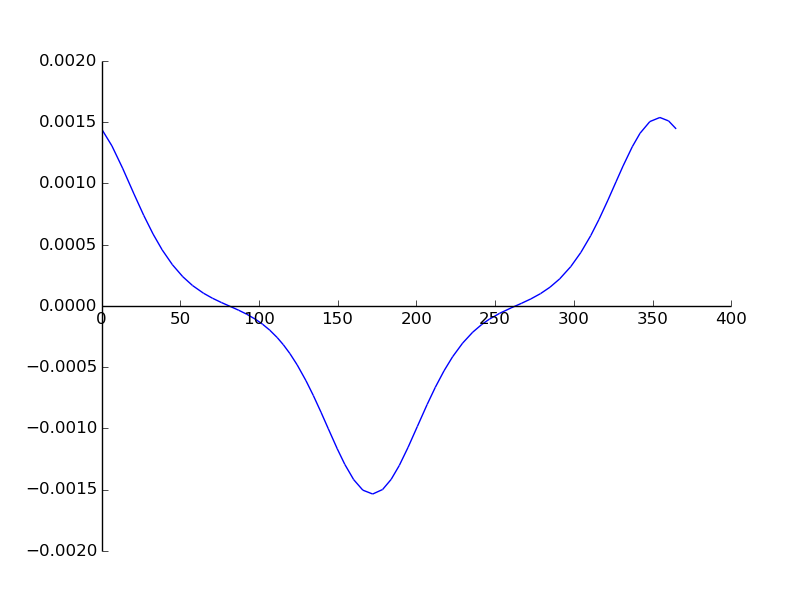
To identify the day when the derivative is zero, we can do it numerically with a Newton method (seeded with r=80, which visually seems to be a good approximation of the zero):
print nsolve(d2LengthDay, 80)
The nsolve returns:
80.7499999999996
Now it’s clear that our maximum is unique, and happens around day number 80(*), which is… March 21st, the vernal equinox! Darn, it seems my friends were right!
(*) If you wonder why I turn 80.749999 into “day number 80” and not “day number 81”, check out the last paragraph of this post.
I was not entirely satisfied with this answer, so I started making tests for other latitudes. The shape of the derivative was very similar to the one I got with Paris, until I started tests with northern latitudes. For example, at 63.5°N, we get:
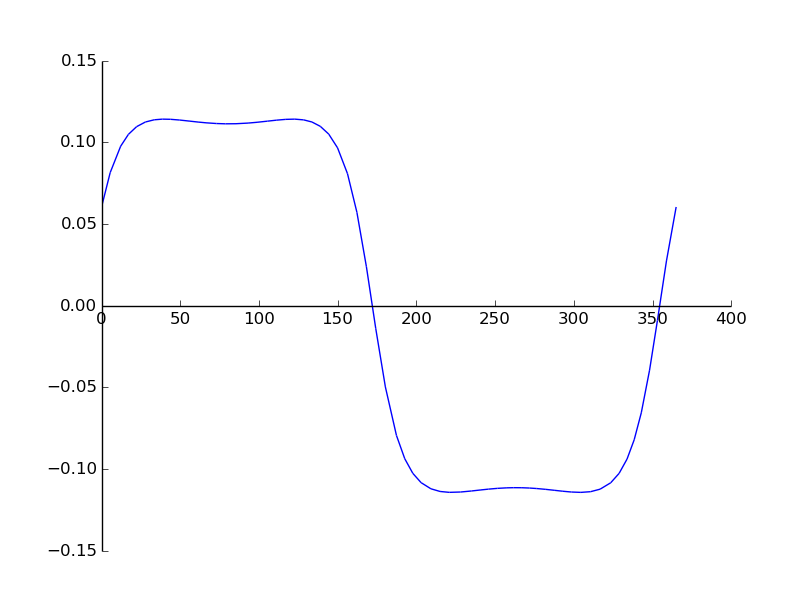
What does this graph mean? It appears that: for r = 80 (spring equinox), we now have a local minimum of the derivative instead of the maximum we had in Paris. The are now two local maxima, one happening between winter and spring, and the other one happening between spring and summer.
We can check this by plotting the second derivative: if we’re right, it will show three zeros between r=1 and r=172:
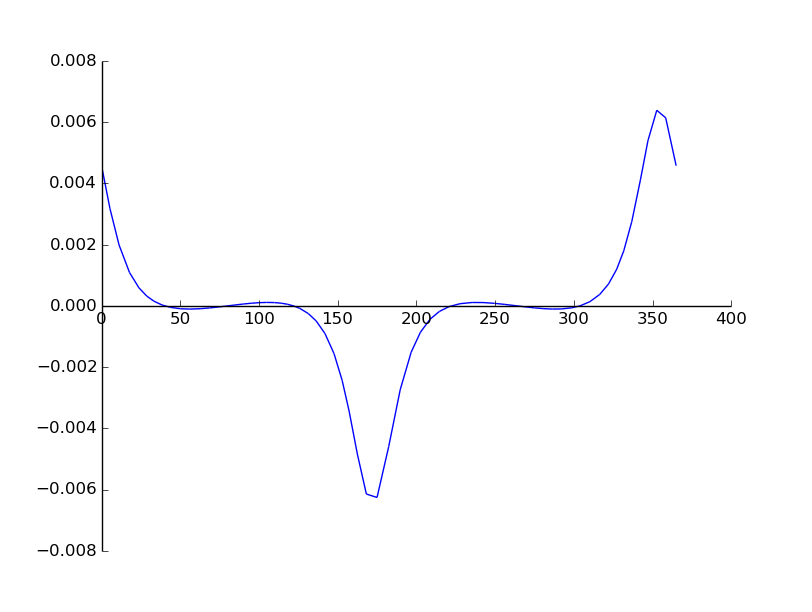
So it seems we were right! Zeros seem to be around 40, 80 and 120. But we can compute the dates of these zeros more precisely. For example, for Fairbanks, Alaska (latitude = 64.843611°), we write:
print nsolve(d2LengthDay, 50)
print nsolve(d2LengthDay, 80)
print nsolve(d2LengthDay, 120)
and get:
39.8279585264938
80.7499999999996
121.672041473505
The first one (r approximately equals 40), means that February, 9th is (one of) the inflection points we were looking for. To ensure that my equation was accurate enough, I compared my result with an astronomical time table. If you look at the “daylength” column, you will see that March 21st is indeed a local minimum, and that there are two local maxima for day length.
After a few tests, I started realizing that for very latitude above approximately 62°N, there were always two maxima, whereas for every latitude below, the only maximum that existed was around spring. This probably means that there exists a limit latitude, above which there are always two maxima, and below which always only one.
To compute (numerically) the limit latitude, we can write a quick and simple binary search:
def searchLimitLatitude(lat, count=0, lastBelow = 0, lastAbove = math.radians(66.56278), latBackup = lat):

	print "Test for latitude = ", math.degrees(lat)
	print "Iteration number: ", count

	lengthDay = 24/(math.pi) * acos(-tan(lat) * tan( asin( sin(delta) * cos(2*(math.pi)/365*(r-172)) ) ) )
	dLengthDay = diff(lengthDay, r)
	d2LengthDay = diff(dLengthDay, r)

	# How many distinct maxima are there?
	max1 = nsolve(d2LengthDay, 50)
	max2 = nsolve(d2LengthDay, 80)

	if(count >=1 and math.fabs(lat - latBackup) <= 1e-7 ): # we ask for 7-digit precision
		print "Finished, limit latitude is: ", math.degrees(lat)
		return lat

	if( math.fabs(max1 - max2) <= 1e-16 ):
		searchLimitLatitude(0.5 * (lastAbove + lat), count+1, lat, lastAbove, lat)
	else:
		searchLimitLatitude(0.5 * (lastBelow + lat), count+1, lastBelow, lat, lat)

print "Search limit latitude...."
lat = math.radians(50) # Initialization
searchLimitLatitude(lat)
Running this program gives:
Iteration number:  22
Finished, limit latitude is:  61.2497155042
As expected, the binary search converged very quickly (just 22 iterations to give a latitude precise within 7 digits!). Finally, we have a value for our limit latitude:
which, according to wikipedia, is just above Anchorage, Alaska and slightly below Tampere, Finland
My friends were partly right: I won’t be able to act snob and celebrate my own holiday. In fact, where I live (Paris, France), inflection point happens on the spring equinox, which many cultures have already been celebrating for centuries.
But, if you live in Fairbanks, Alaska, I suggest you call your boss to let him know you won’t be coming to work on February, 9th (which happens to be the day this is posted!);)
You might wonder why when we found an inflection point on date 80.74999 for Paris, I said the corresponding day was #80 (March 21st), and when we found 39.8279 for Fairbanks, I said the corresponding day was #40. In fact, we reach here the limits of our simplified equation. One of the assumptions we made was to consider that the Sun was located at infinite distance from Earth (ie that the Sun was just a tiny point in the sky). Of course, this is not true, and it can lead to small errors if we stick to our equation. For example, on the vernal equinox at the North Pole, day length is really about 6 minutes longer than our equation predicts. In order to decide which day was really the day of the maximum increase in day length, I had to “cheat” a little (because I needed a more precise equation) by checking an astronomical table for these locations.
Something also worth noting is that there is also a slight modification of Earth’s tilt axis every year, which means the second derivative (and thus the inflection point) also changes every year. I don’t really have time for more than a few tests, but location of the inflection point seems to be very sensitive the parameters of the equation. This means that inflection point in Fairbanks could happen on very different dates each year.
EDIT : As Boris pointed out in the comments, I could have dealt with my problem more simply, by writing day length as a discrete series of 365 days, instead of deriving a continuuous function. With the continuuous method, day number “39.9” doesn’t make much sense, and I couldn’t decide whether it was February, 8th (#39) or February, 9th (#40). Using finite sequences, I needn’t have used the astronomical table for Fairbanks, for the day I was looking for would just have been the max of the delta series.