Browsed by
Tag: r

Rugby World Cup explainer using data

Rugby World Cup explainer using data

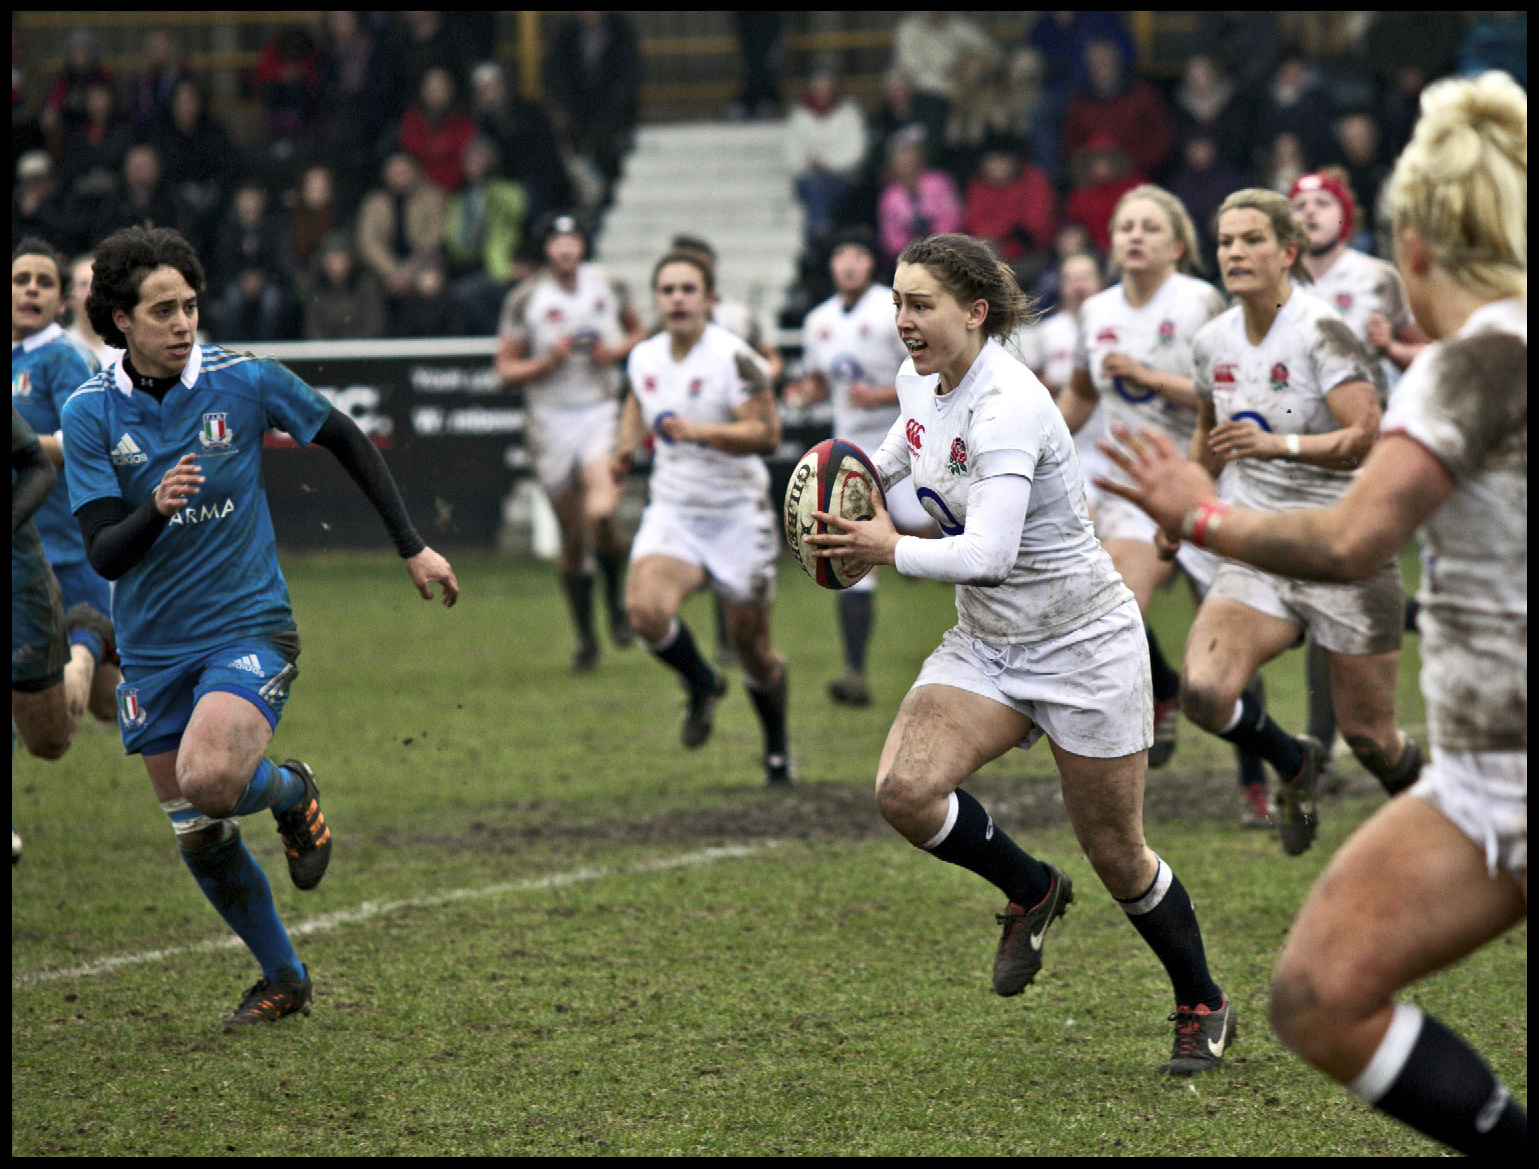
Last week, a stereotypical “French” ceremony opened the 10th Rugby World Cup in Stade de France, in the suburbs of Paris, France. As a small boy growing up in the southern half of France, I developed a strong interest for the sport. Now being an adult living and working in North America, where barely anyone has ever heard the word “Rugby”, I now rarely have anyone else to talk to about Antoine Dupont’s (captain of the French team and best…

Read More Read More

Using R to build predictions for UEFA Euro 2020

Using R to build predictions for UEFA Euro 2020

Last friday, Euro 2020, one of the biggest events in International soccer, was kicked off by the inaugural match between Italy and Turkey (Italy won it 3-0). Euros (short for European Championships) are usually held every 4 years, but because of he-who-must-not-be-named, last year’s edition was postponed to this summer, while keeping the name “Euro 2020” (much like the Tokyo Olympics). 4 5 years ago, for Euro 2016, I basically wanted to try some cool methods based on splines on…

Read More Read More

Have you checked your features distributions lately?

Have you checked your features distributions lately?

tl;dr Trying to debug a poorly performing machine learning model, I discovered that the distribution of one of the features varied from one date to another. I used a simple and neat affine rescaling. This simple quality improvement brought down the model’s prediction error by a factor 8 Data quality trumps any algorithm I was recently working on a cool dataset that looked unusually friendly. It was tidy, neat, interesting… the kind of things that you rarely encounter in the wild!…

Read More Read More

Creating an hex map of France electricity consumption

Creating an hex map of France electricity consumption

The French Ministry for the Ecological and Inclusive Transition (for which I’m currently working) is ongoing a process of opening data related to energy consumption. Each year, we publish data for every neighborhood in France (at the iris statistical level, even adresses in some cases) and to the nature of the final consumer (a household, an industry, a shop…). These data are available here (website in French – direct link to 2018 electricity consumption data). Making a map to have…

Read More Read More

Maquereaux et départements

Maquereaux et départements

Cette semaine, l’énigme “classique” de FiveThirtyEight (qu’on peut retrouver ici) demande de trouver des mots n’ayant aucune lettre en commun avec un et seul état américain. Par exemple, “mackerel” (le maquereau) a des lettres en commun avec tous les états sauf l’Ohio. Ce problème peut s’adapter au cas français : quels sont les mots n’ayant aucune lettre en commun avec un et un seul département français ? En reprenant la liste de mots utilisés pour notre article sur Motus et…

Read More Read More

Rolling some dices

Rolling some dices

Today, a quick post trying to provide an answer to this week Riddle Classic on FiveThirtyEight : The fifth edition of Dungeons & Dragons introduced a system of “advantage and disadvantage.” When you roll a die “with advantage,” you roll the die twice and keep the higher result. Rolling “with disadvantage” is similar, except you keep the lower result instead. The rules further specify that when a player rolls with both advantage and disadvantage, they cancel out, and the player rolls a single die….

Read More Read More

Causal Inference cheat sheet for data scientists

Causal Inference cheat sheet for data scientists

Being able to make causal claims is a key business value for any data science team, no matter their size.Quick analytics (in other words, descriptive statistics) are the bread and butter of any good data analyst working on quick cycles with their product team to understand their users. But sometimes some important questions arise that need more precise answers. Business value sometimes means distinguishing what is true insights from what is incidental noise. Insights that will hold up versus temporary marketing…

Read More Read More

The Mrs. White probability puzzle

The Mrs. White probability puzzle

tl;dr -I don’t remember how many games of Clue I’ve played but I do remember being surprised by Mrs White being the murderer in only 2 of those games. Can you give an estimate and an upper bound for the number of games I have played?We solve this problem by using Bayes theorem and discussing the data generation mechanism, and illustrate the solution with R. Making use of external information with Bayes theorem Having been raised a frequentist, I first…

Read More Read More

Ranking places with Google to create maps

Ranking places with Google to create maps

Today we’re going to use the googleway R package, which allows their user to do requests to the GoogleMaps Places API. The goal is to create maps of specific places (restaurants, museums, etc.) with information from Google Maps rankings (number of stars given by other people). I already discussed this in french here to rank swimming pools in Paris. Let’s start by loading the three libraries I’m going to use : googleway, leaflet to create animated maps, and RColorBrewer for…

Read More Read More