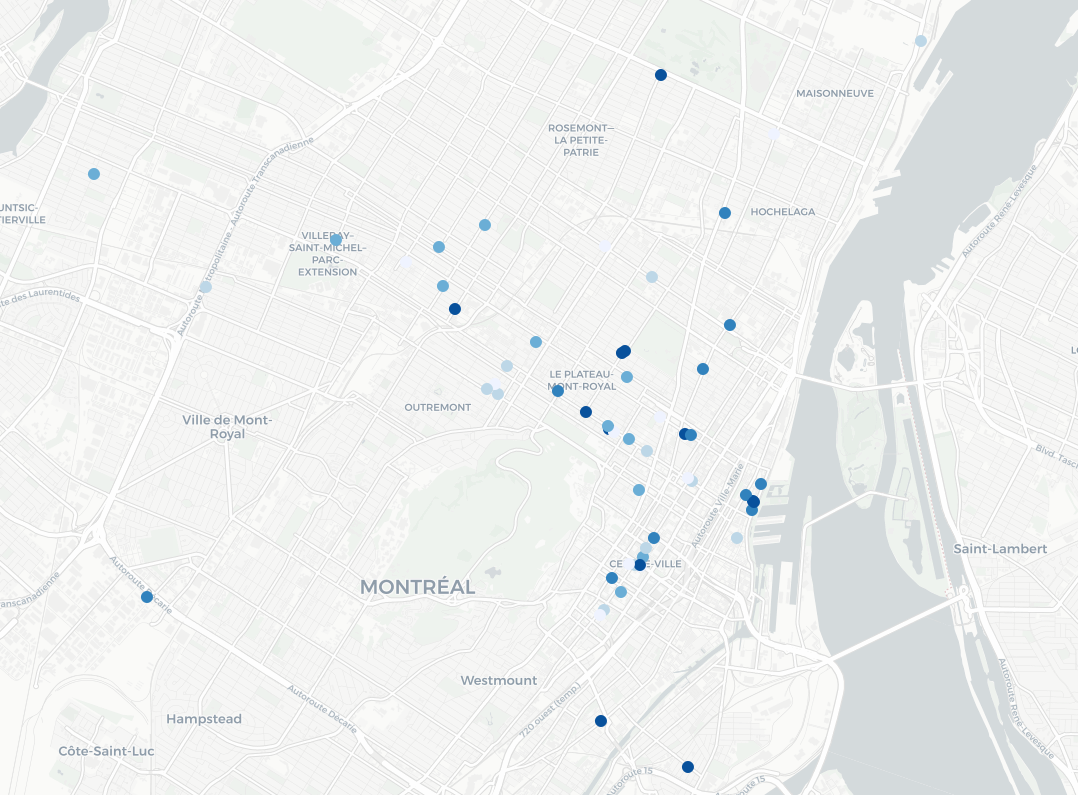
Creating an hex map of France electricity consumption

The French Ministry for the Ecological and Inclusive Transition (for which I’m currently working) is ongoing a process of opening data related to energy consumption. Each year, we publish data for every neighborhood in France (at the iris statistical level, even adresses in some cases) and to the nature of the final consumer (a household, an industry, a shop…). These data are available here (website in French – direct link to 2018 electricity consumption data).

Making a map to have an overlook at the situation isn’t easy, because the administrative boundaries of France are very diverse, and a direct mapping will reflect this situation. In order to overcome this issue, a solution is to use a different way to represent the country. In this post, we’re going to talk about hex map (as inspired by this website).

What’s a hex map? First, we need to talk about chloropleth maps; despite their unusual names, they’re perfectly common maps where each area is shaded or colored differently according to the values taking by a variable. They’re quite similar to maps such as this one showing which political party won an election on each voting district, but for continuous variable, and required a scale. To determine the color used for each area, we need to compute the average (or any statistical summary) of the values of every individual belonging in this area.

Hex map are entirely composed of hexagons (something perfectly suited for France!); they’re chloropleth maps, so each hexagon is colored depending on the values taking by a variable. The main difference is that the hexagon aren’t usual geographical areas so we need a way to attribute each value in our data set to one of the hexagons before calculating averages, and therefore colors.

In order to do that, we’re going to load some usual R-packages:

library(tidyverse)  
library(viridis)   
library(ggplot2)   
library(stringr)

Our objective will be to make an hex map of residential consumption of electricity in 2018. First, we need to import the data at iris level (doing this, we miss some of the electricity consumption only associated to larger geographical area, but it’s marginal); as the data is coded as strings with some missing values, we start by cleaning the data.

elec <- read.csv2("donnees_elec_iris_2018.csv",stringsAsFactors = F)
elec <- elec[elec$CONSO != "s" & elec$PDL != "s",] #"s" are missing values

# CONSO (electricity consumption) is coded with a french comma separator ; we need to substitute that and convert to numeric CONSO and PDL (number of  energy delivery points) 
elec$CONSO <- str_replace(elec$CONSO,",",".") 
elec$CONSO <- as.numeric(elec$CONSO)
elec$PDL <- as.numeric(elec$PDL)

# Select only residential sector
res <- elec[elec$CODE_GRAND_SECTEUR == "R",]

Each data point is then associated to the coordinates of the center of the neighborhood, using a iris shapefile (available here). The res dataset obtained looks like this:

  CODE_IRIS      CONSO  PDL     x    y
  100020000   843.8162  124 48.25 4.69
  100030000 10374.7166 1987 48.24 3.72
  100040000   679.8085   88 48.59 4.12
  100050000   769.8268  145 48.29 4.49
  100060000  7318.2055 1534 48.53 4.14
  100070000   429.9674   61 48.16 4.73
  100080000   343.1404   62 48.25 4.60
  100090000   262.1539   55 48.05 4.28
  100100000   140.5366   28 48.54 4.61
  100110000   700.1244  113 48.27 4.74

We’re using a ggplot2 environment to create our hex map. The aesthetics used are aes(x,y), the spatial coordinates. We begin by these line of code in order to use a simpler theme (as we’re creating a map, we don’t need any axis) and to specify the positions (longitude and latitude) we want to map.

c <- ggplot(res, aes(x, y))
c + 
xlim(-9, 12) +
ylim(40, 52) +   
theme_void() 

The main argument of the stat_summary_hex function we’re going to use is bins. This parameter allows us to choose how many hexagons will be displayed on the map; the more hexagon, the more small local variations are shown. For the other parameters, we specify aes(z = CONSO) as we want to color the hexagons in relation to the CONSO (Consumption in french) of the data points contained in this area. The fun = “sum” parameter means that the choice of the color of the hexagon depends on the total consumption inside. Lastly, we add a colour=”grey” parameter, which defines the color of every hexagon’s borders, because using white borders on my computer leads to some graphical artefacts (see here).

c <- ggplot(res, aes(x, y))
c +  stat_summary_hex(bins=40,aes(z = CONSO),fun = "sum", colour="grey") +
xlim(-9, 12) +
ylim(40, 52) +   
theme_void() 

We then define a scale (both numeric and in terms of colors) using the scale_fill_viridis function. In order to better see large differences, we use the trans=”log” option which means that transitions between colors are logarithmic and not arithmetic progressions. The breaks points used are 1 GWh, 10 GWh, 100 GWh and 1 TWh.

 c <- ggplot(res, aes(x, y))
c +  stat_summary_hex(bins=40,aes(z = CONSO),fun = "sum", colour="grey") +
xlim(-9, 12) +
ylim(40, 52) +   
theme_void() +
scale_fill_viridis(
 option="A",
 trans = "log", 
 breaks = c(0,1000,10000,100000,1000000,99999999999),
 name="Electricity Consumption", 
 guide = guide_legend(keyheight = unit(2.5, units = "mm"),      keywidth=unit(4, units = "mm"), 
label.position = "bottom", 
title.position = 'top', nrow=1) )  

Using the following code with bins = 80 results in this another map:

c <- ggplot(res, aes(x, y))
c +  stat_summary_hex(bins=80,aes(z = CONSO),fun = "sum", colour="grey") +
xlim(-9, 12) +
ylim(40, 52) +   
theme_void() +
scale_fill_viridis(
 option="A",
 trans = "log", 
 breaks = c(0,1000,10000,100000,1000000,99999999999),
 name="Electricity Consumption", 
 guide = guide_legend(keyheight = unit(2.5, units = "mm"),      keywidth=unit(4, units = "mm"), 
label.position = "bottom", 
title.position = 'top', nrow=1) )  

These map highlight the position of urban centers with high population density. A more useful information is the total electricity consumption per household (or, more accurately in this case, per energy delivery point, whose quantity per iris is PDL in the dataset), defined this way:

res$ElectricityPerHousehold <- res$CONSO/res$PDL

The code used to generate the map is slighty similar; the stat_summary_hex parameter are modified to aes(z = ElectricityPerHousehold) and fun=”mean”, and, scale_fill_viridis parameters are switched to option=”E” (leading to a new color scheme), new breakpoints of 2, 4, 6 and 8 GWh per household, and a new legend name.

 c <- ggplot(res, aes(x, y))
c +  stat_summary_hex(bins=80,aes(z = ElectricityPerHousehold),fun = "mean", colour="grey") +
xlim(-9, 12) +
ylim(40, 52) +   
theme_void() +
scale_fill_viridis(
 option="E",
 trans = "log", 
 breaks = c(0,2,4,6,8,10),
 name="Electricity Consumption per Household", 
 guide = guide_legend(keyheight = unit(2.5, units = "mm"),      keywidth=unit(4, units = "mm"), 
label.position = "bottom", 
title.position = 'top', nrow=1) )  

This map better hightlights places with large electricity consumptions; Paris and its suburbs are associated to lower consumptions per household, which contrasts with an unusually high total consumption, due to high population density. An high consumption per household is usually associated to electric heating and/or large houses, and parisian dwellings are mostly smaller flats.

Featured image: Electricity Converter Power, by ArtisticOperations

Ranking places with Google to create maps

Today we’re going to use the googleway R package, which allows their user to do requests to the GoogleMaps Places API. The goal is to create maps of specific places (restaurants, museums, etc.) with information from Google Maps rankings (number of stars given by other people). I already discussed this in french here to rank swimming pools in Paris. Let’s start by loading the three libraries I’m going to use : googleway, leaflet to create animated maps, and RColorBrewer for color ranges.

library(googleway)
library(leaflet)
library(RColorBrewer)

First things first. To do API request to Google, we need an API key ; you can ask for one here. We’ll use this key for the rest of the program, so let’s declare a global variable :

api_key <- "YourKeyHereIWontGiveYouMine"

Retrieving Google Data

We’re going to use the google_places function to get a list of places matching a description, called research in my program (for instance : “Restaurant, Paris, France”). The output are multiple, and I’m going to store the place ID and the rating. I’ll also store the research token ; that’ll be explained later.

gmaps_request <- google_places(search_string = research, language = language, key = api_key)
  gmaps_data <- gmaps_request$results
  
  place_id <- gmaps_data$place_id
  rating <- gmaps_data$rating
  
  token <- gmaps_request$next_page_token

This function returns up to 20 places associated to the research by Google. If you want more than 20, you need to use the token previously stored in order to ask the Google Places API to give you the next results, by tweaking the function this way :

gmaps_request <- google_places(search_string = research, language = language, key = api_key, page_token = token)

There are tow caveats to this function. Firstly, the token can be NULL. In this case, there isn’t any further research results you can get. This happens automatically as soon as you reach 60 results. Secondly, the API needs time to refresh the token research (see here) ; that’s why we’re going to make R wait a few seconds, using Sys.sleep(time) between our requests. Our complete function is therefore :

gmaps_request <- google_places(search_string = research, language = language, key = api_key)
  gmaps_data <- gmaps_request$results
  
  place_id <- gmaps_data$place_id
  rating <- gmaps_data$rating
  
token <- gmaps_request$next_page_token
Sys.sleep(5)
continue <- TRUE

  while (continue) {
    
    gmaps_request <- google_places(search_string = research, language = language, key = api_key, page_token = token)
    gmaps_data <- gmaps_request$results
    
    if (!is.null(gmaps_request$next_page_token)) {
      place_id = c(place_id,gmaps_data$place_id)
      rating = c(rating,gmaps_data$rating)
      token <- gmaps_request$next_page_token
      Sys.sleep(5)
    }
    else{continue <- FALSE}
  }

Now we’re going to search for the spatial coordinates of the places we found. To this extent, we’re going to use the google_place_details function of the packages, and retrieve latitude and longitude with these two functions :

get_lat <- function(id, key, language) {
  id <- as.character(id)
  details <- google_place_details(id, language = language, key=key)
  return(details$result$geometry$location$lat)
}

get_lng <- function(id, key, language) { 
  id <- as.character(id)
  details <- google_place_details(id, language = language, key=key)
  return(details$result$geometry$location$lng) 
}

All these blocks add up to build the complete function :

get_gmaps_data <- function(research, api_key, language) {
  
  gmaps_request <- google_places(search_string = research, language = language, key = api_key)
  gmaps_data <- gmaps_request$results
  
  place_id <- gmaps_data$place_id
  rating <- gmaps_data$rating
  
  token <- gmaps_request$next_page_token
  Sys.sleep(5)
  continue <- TRUE
  
  while (continue) {
    
    gmaps_request <- google_places(search_string = research, language = language, key = api_key, page_token = token)
    gmaps_data <- gmaps_request$results
    
    if (!is.null(gmaps_request$next_page_token)) {
      place_id <- c(place_id, gmaps_data$place_id)
      rating <- c(rating, gmaps_data$rating)
      token <- gmaps_request$next_page_token
      Sys.sleep(5)
    }
    else{continue <- FALSE}
  }
  
  lat = sapply(place_id, get_lat, key=api_key, language=language)
  lng = sapply(place_id, get_lng, key=api_key, language=language)
  
  return(data.frame(place_id, rating, lat, lng))
}

Map plot

The next part is more classical. We’re going to order the ratings of the data frame built by the previous function in order to arrange the places in differents groups. Each of the groups will be associated to a color on the data plot. If we want to make number_colors groups with the color scheme color (for instance, “Greens”), we are using the following instructions :

color_pal <- brewer.pal(number_colors, color)
pal <- colorFactor(color_pal, domain = seq(1,number_colors))

plot_data <- gmaps_data
plot_data$ranking <- ceiling(order(gmaps_data$rating)*number_colors/nrow(plot_data))

The definitive function just needs the addition of the leaflet call :

show_map <- function(number_colors, gmaps_data, color="Greens") {
  
color_pal <- brewer.pal(number_colors,color)
pal <- colorFactor(color_pal, domain = seq(1,number_colors))

plot_data <- gmaps_data
plot_data$ranking <- ceiling(order(gmaps_data$rating)*number_colors/nrow(plot_data)) leaflet(plot_data) %>% addTiles() %>%
  addCircleMarkers(
    radius = 6,
    fillColor = ~pal(ranking),
    stroke = FALSE, fillOpacity = 1
  ) %>% addProviderTiles(providers$CartoDB.Positron)
}

Examples

I just need to combine these two functions in one, and then to do some food-related examples !

maps_ranking_from_gmaps <- function(research, api_key, language, number_colors=5, color="Greens") {
  show_map(number_colors, get_gmaps_data(research, api_key, language), color)
}

maps_ranking_from_gmaps("Macaron, Paris, France", api_key, "fr")
maps_ranking_from_gmaps("Macaron, Montreal, Canada", api_key, "fr")

maps_ranking_from_gmaps("Poutine, Montreal, Canada", api_key, "fr", 5, "Blues")
maps_ranking_from_gmaps("Poutine, Paris, France", api_key, "fr", 5, "Blues")

which returns the following maps :

Macaron in Paris, France

Macaron in Montreal, Canada

Poutine in Montreal, Canada

Poutine in Paris, France (I guess French people are not ready for this)