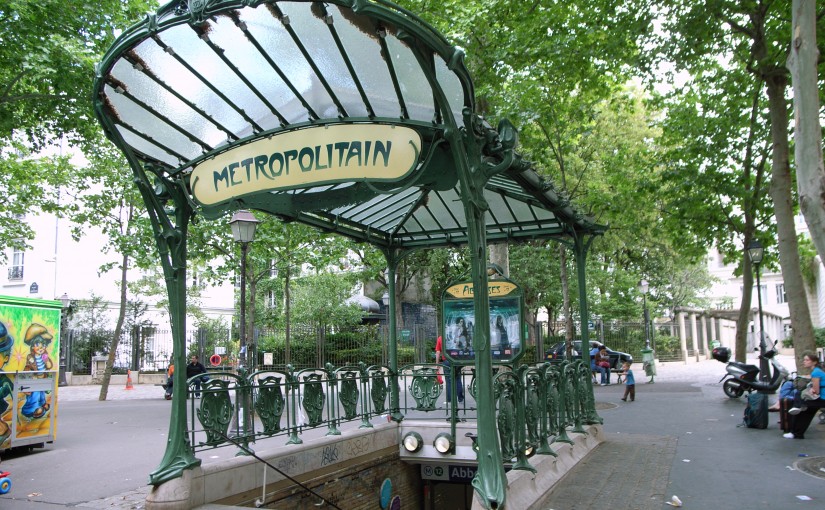
I spend a lot of time in the Parisian subway, as I use it everyday to go to work, and sometimes to meet some friends of mine. I usually spend my time listening to music and asking myself lots of questions about its organisation : how the time frequencies of subways are decided ? How can empty trains become completly full within minutes ? I guess there are people working on that, but there are some sillier questions I doubt anyone is paid to look for an answer to.
One of these came recently into my mind when I was on the “ligne 13”, between “Montparnasse Bienvenue” and “Porte de Vanves”. I realized that I passed through 4 stations which were in alphabetical order.
So now I wonder : using only the subway, what is the maximal number of stations in alphabetical order you could go through? I already know it is at least 4 because I do that every morning or so, but could we go up to 5, 6, 7, or maybe more ? Let’s do some research!
5 stations in a row…
I’m a very lazy person, so I’m not going to do it by looking at all the lines in the Paris Metro, but I’d rather ask gently my computer to do it for me. First, I need to gather some data about the stations’ name on every line of the metro. These informations are available at different places, such as Wikipedia and “data.gouv”, which is the official French governement website on open data.
All left to do is an easy computation of the maximum number of stations in alphabetical order for each line, going back and forth. The algorithm used is thereby (in pseudocode):
maximum_number <- function(Line) {
    for Station in Line {
    if (Station > Station_prec) {Counter <- Counter + 1}
    else {Maximum = max(Maximum,Counter) ; Counter = 1}
     }
  Maximum = max(Maximum,Counter);
  return(Maximum)
}
The results obtained are compiled in this graph:
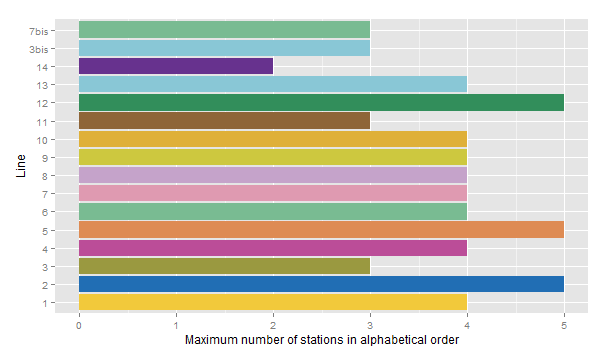
The answer to my question seems to be 5 stations: "ligne 2" (Belleville / Couronnes / Ménilmontant / Père Lachaise /Philippe Auguste), "ligne 5" (Bobigny-Pablo Picasso / Bobigny-Pantin-Raymond Queneau / Église de Pantin / Hoche / Porte de Pantin) or "ligne 12" (Falguière / Montparnasse-Bienvenüe / Notre-Dame-Des-Champs / Rennes / Sèvres-Babylone).
... or maybe more?
Ok, so I was right 4 wasn't the best I could do. But I feel like I'm forgetting something... Of course, the connections between the lines! The Paris Metro is organized around huge hubs such as "Montparnasse-Bienvenüe" which belong to plenty of lines, so I guess using these big stations might get us to better than 5, right?
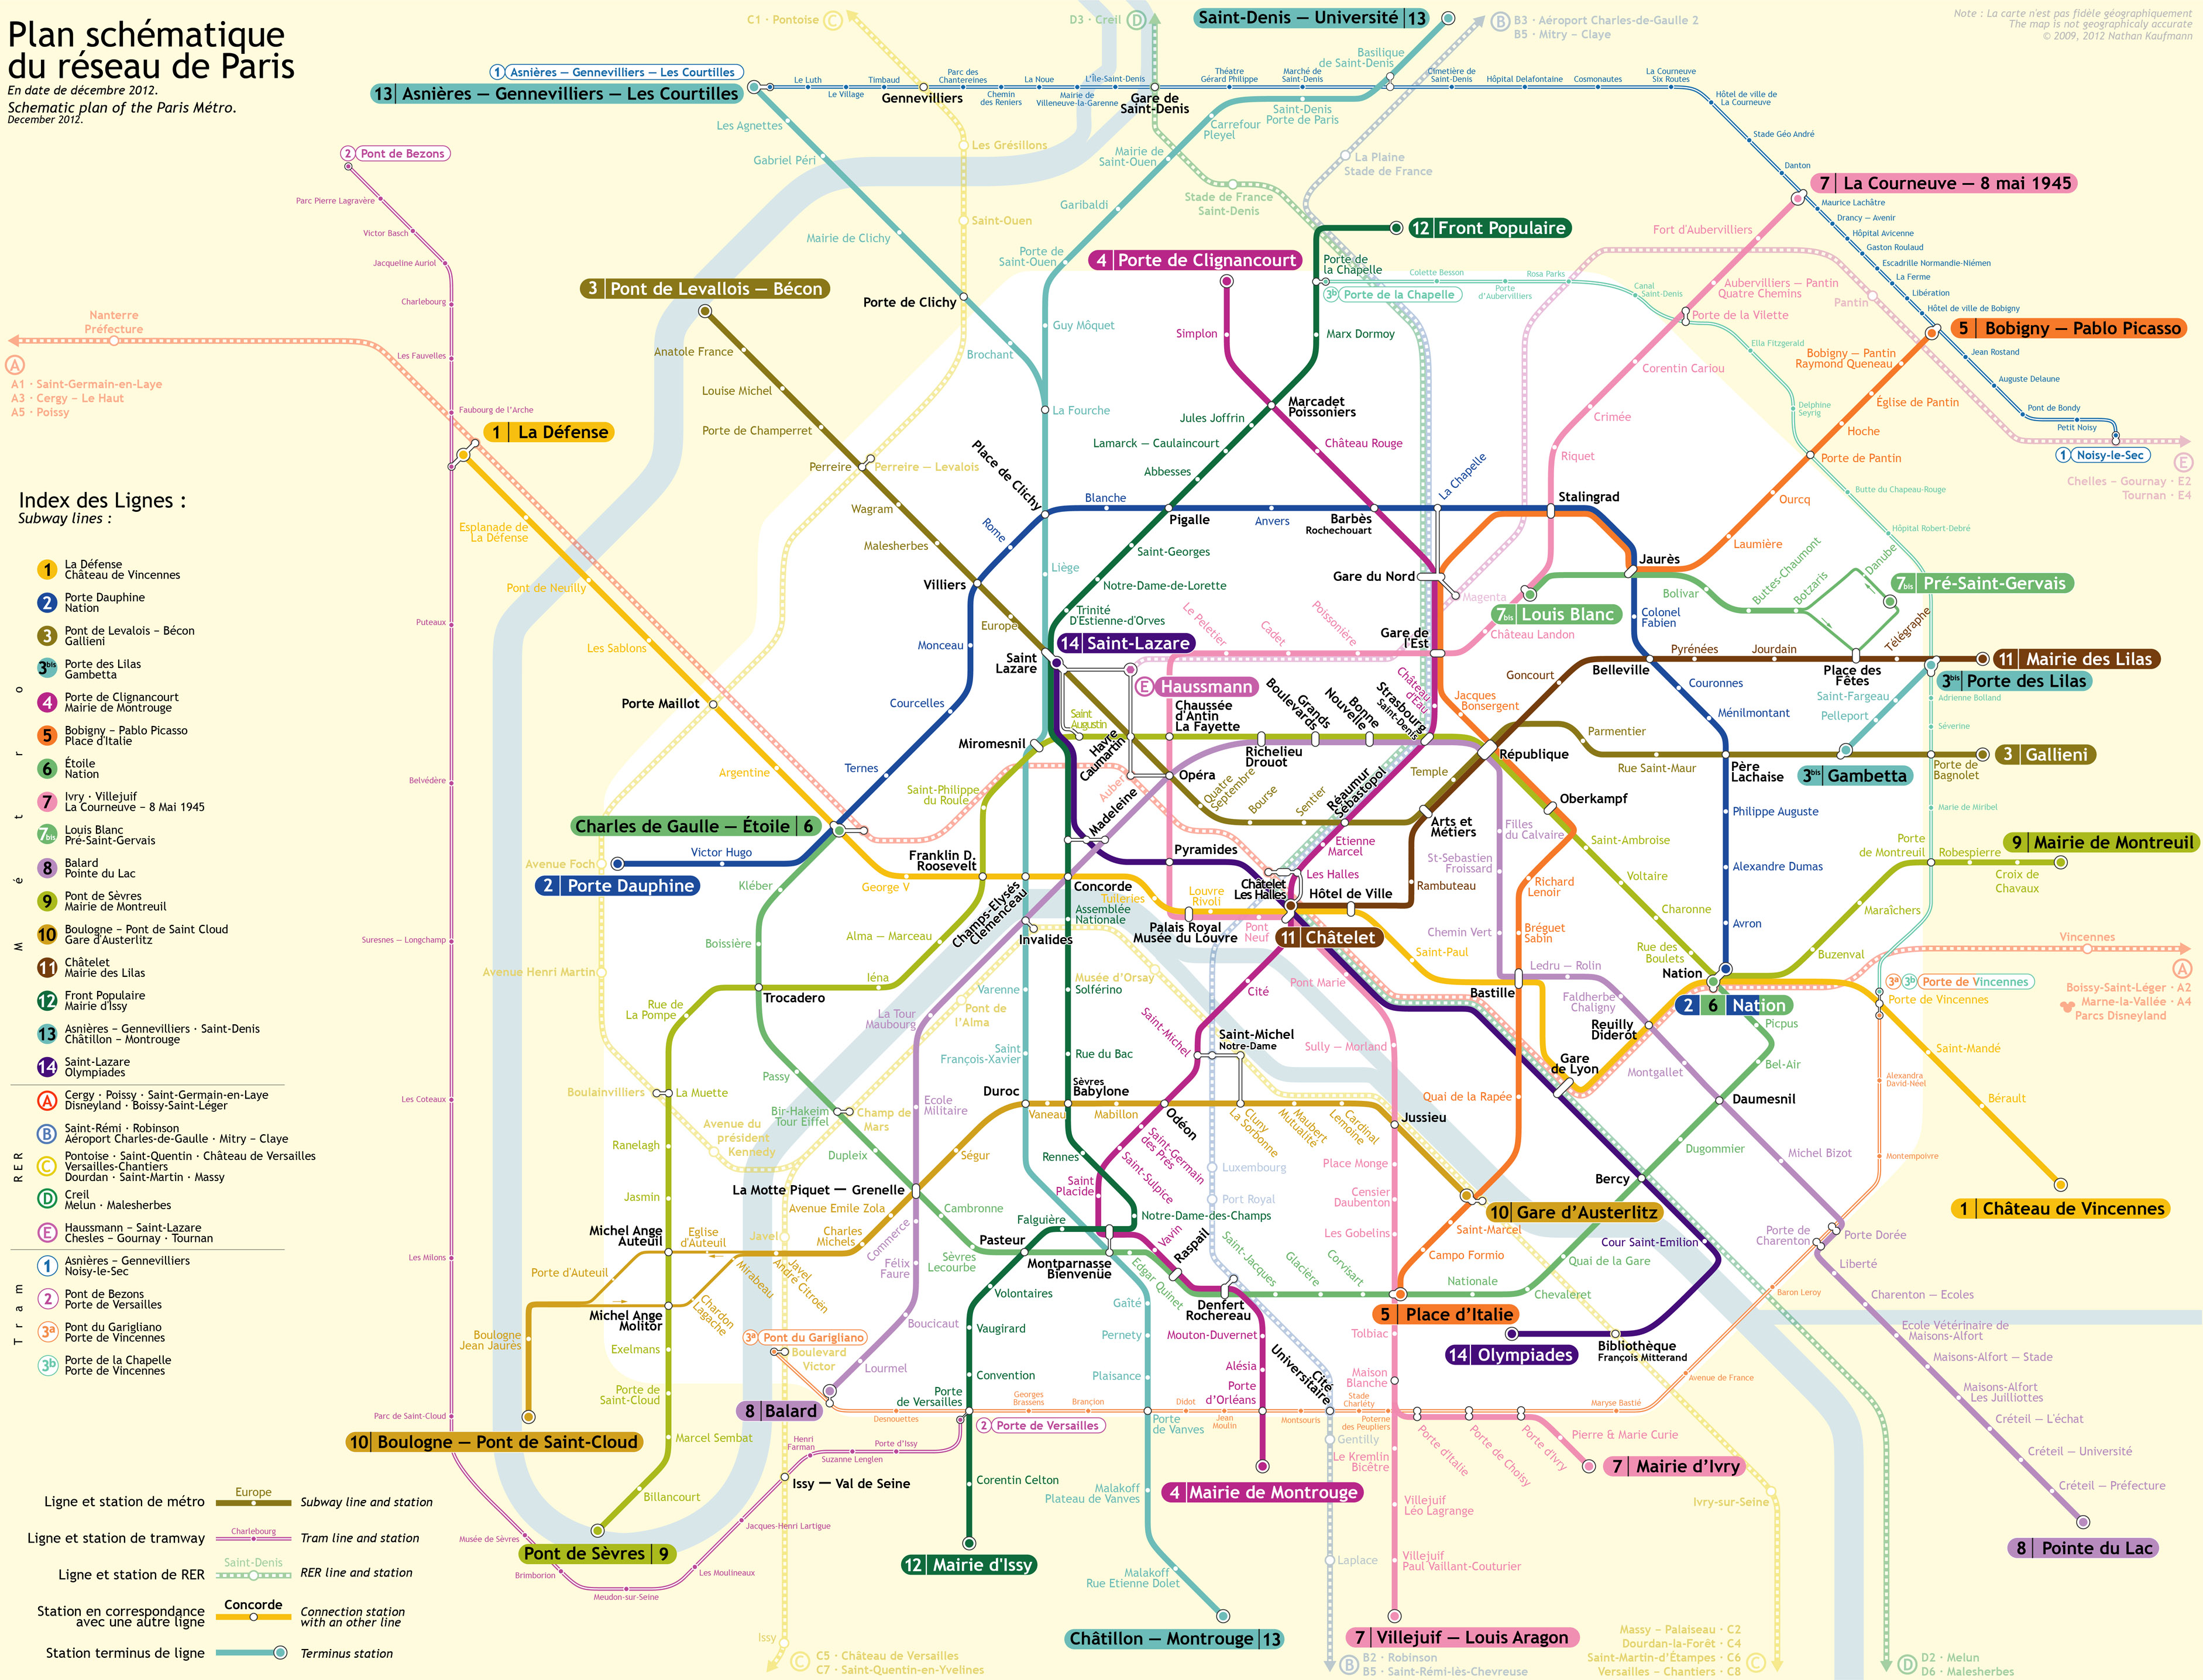
As you may know, the organization of the subway is quite complex. To simplify my study, I will consider that two lines are connected at a station iff the station's name is the same on the two lines. For instance, on the map previously shown, I consider "La Chapelle" and "Gare du Nord" not to form a connection, but "Gare du Nord" to be one on its own, between Line 4 and 5.
The algorithm I use is a more complex than the previous one. It requires to browse through all the subway network in order to find the higher number of stations in alphabetical order. For those with some computing background who are used to recursive functions, here is my pseudocode :
 max_length <- function(Station) {
	Connections = connection_list(Station)
        Values = void()
	for (Line in Connections)
		{ Next_Station = Line[id_Station + 1]
                  Values = c(Values, max_length(Next_Station) }
	return(max(Values))
}
And the result is... 6! Well, I though that using the connections might lead to an higher number of stations, but whatever. There are numerous ways to achieve the maximum number:
- Belleville (2) / Colonel Fabien (2) / Jaurès (2->5) / Laumière (5) / Ourcq (5) / Porte de Pantin (5)
- Duroc (13) / Montparnasse Bienvenue (13->12) / Notre-Dame des-Champs (12) / Rennes (12) / Sèvres Babylone (12->10) / Vaneau (10)
- Gaité (13) / Montparnasse Bienvenue (13->12) / Notre-Dame des-Champs (12) / Rennes (12) / Sèvres Babylone (12->10) / Vaneau (10)
- Edgar Quinet (6) / Montparnasse Bienvenue (6->12) / Notre-Dame des-Champs (12) / Rennes (12) / Sèvres Babylone (12->10) / Vaneau (10)
- Falguière (12) / Montparnasse Bienvenue (12) / Notre-Dame des-Champs (12) / Rennes (12) / Sèvres Babylone (12->10) / Vaneau (10)
Well, there are at least two completly different ways to achieve the record of 6 stations in a row: the first one, in the northeastern part of Paris, and the 4 others located near Montparnasse. Fun fact: before 1942, Montparnasse and Bienvenüe were two different stations (see there), and "Porte de Pantin" station wasn't built (see there): therefore the only possible circuit was :
- Falguière (12) / Montparnasse
Bienvenue(12) / Notre-Dame des-Champs (12) / Rennes (12) / Sèvres Babylone (12->10) / Vaneau (10)
But I guess there were more urgent things to deal with at this time.
Let's simulate some graphs!
I'm now wondering what would happen if I did this kind of analysis for all the subway network all around the world. But as I mentionned before, I'm kind of lazy, so I won't try to gather all the data about all these networks. Another approach is to try to know if the Paris Metro network is particular, or if it behaves like an average graph. So I'll try to simulate some networks, compute the maximum number of ordered nodes, and compare the mean value obtained to 6.
A graph is a representation of a set of objects, denoted the vertices, which are the stations here, and the relations between them. Each time two vertices A and B are in relation, there is a link, denoted an edge, going from A to B. In our subway example, it will mean that you can go directly from station A to station B without any stop. We will consider it as a symmetric graph, which means that when you can go from A to B you can also go back to A from B, even if in the Paris Métro there is some absurd lines (for instance, the West part of the "ligne 10").
Unfortunately, simulating a subway network is quite hard (citation needed). As I only have small knowledge of graph theory, I'll try the simplest way to simulate a graph, which happens to be the Erdos-Renyi method: we first generate 300 vertices (because there is about 300 stations in Paris), numbering them from 1 to 300. Then, for each possible link between two stations, we roll a (odd) dice to determine if there is an edge or not. The dice is designed in order to obtain an average of 371 edges, because there is 371 links in the parisian network.
Using R, I simulated 1000 graphs with this method. Then for each of them I apply an algorithm, similar to the one previously presented, to get the maximum number of ordered vertices, using the label given to them. I obtain the following results:
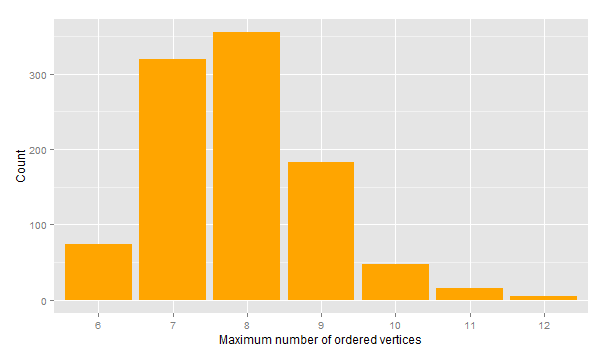
It seems that 6 is at the bottom of the distribution of the maximum number of ordered stations (average is about 7.8), which may lead us to think that we are unlucky in Paris. But we have to keep in mind a few things :
- First, the model used here isn't at all a good model for subway network. So this comparison is a little fallacious, and we shouldn't jump to any conclusion.
- Someting else that may explain the difference between the simulations and Paris Métro is that the names of the stations aren't really uniformly distributed: there are some spatial correlations between the names, for instance all the "Porte de" are located near Paris' exits, and "Bobigny-Pablo Picasso" and "Bobigny-Pantin-Raymond Queneau" are obviously close stations. This might lead to less randomness and biased results.
I guess I have to do the job for all the other subways. I think I will start with this one!
Image titre : Paris Métro Entrance, Abbesses
