Rugby World Cup explainer using data
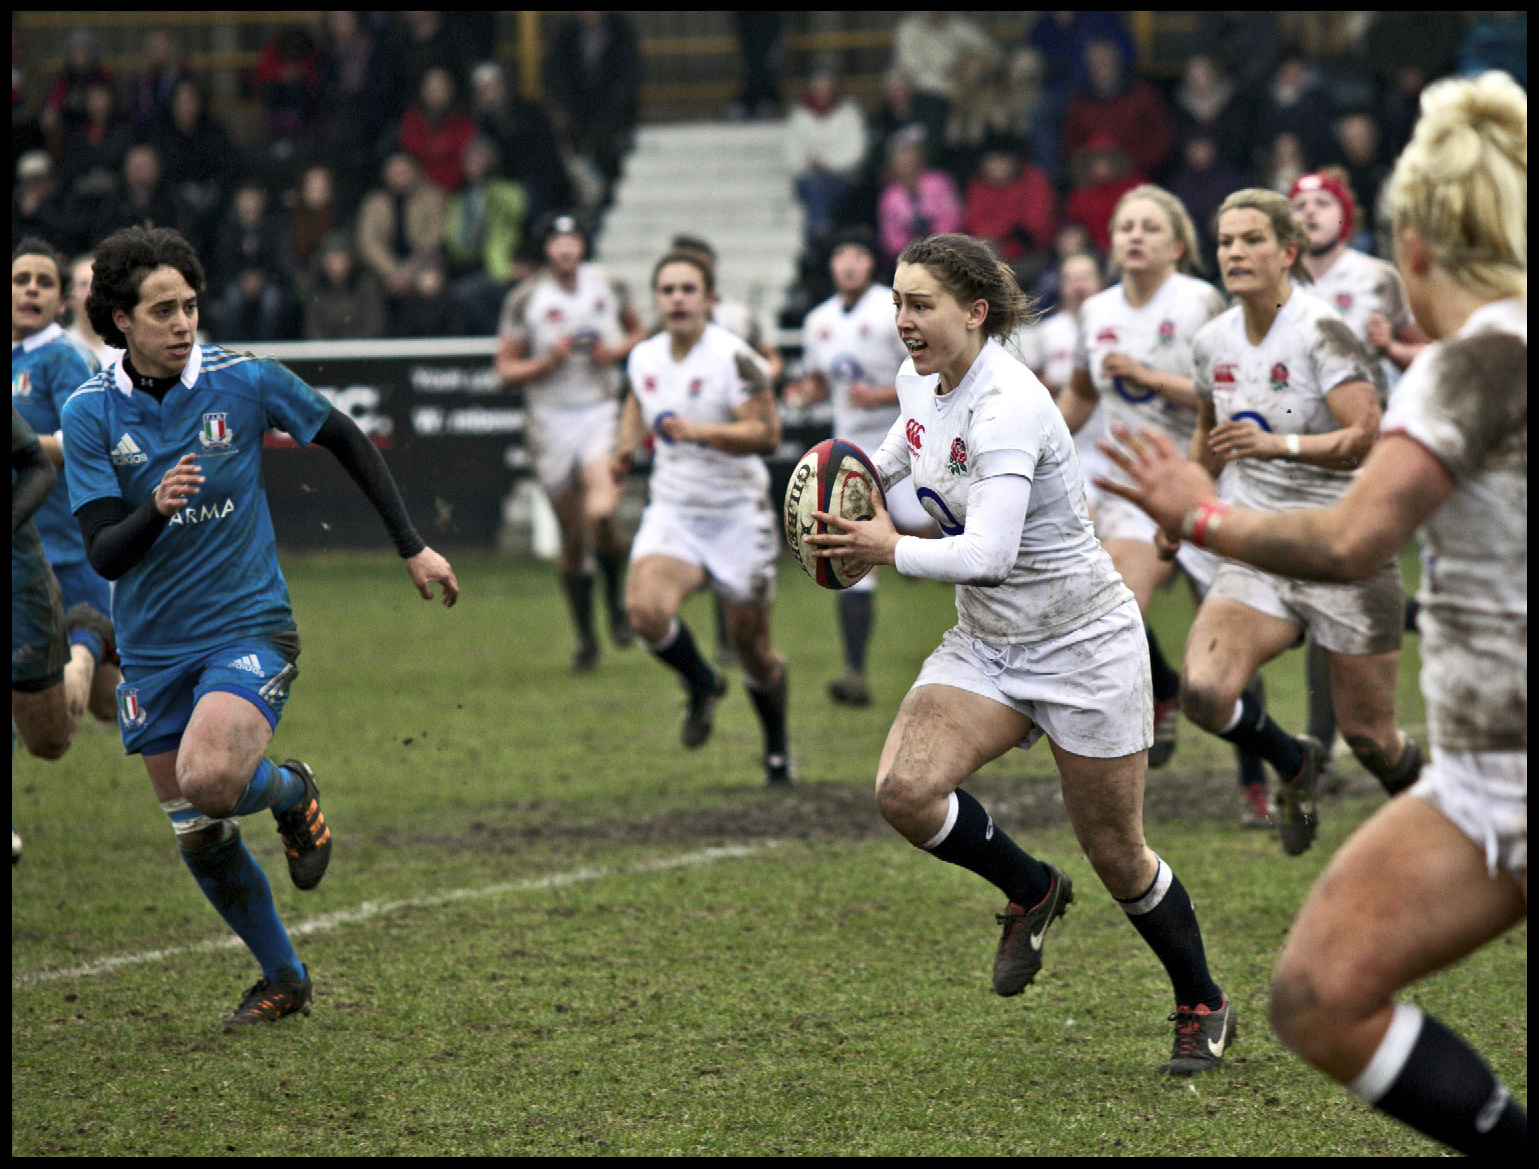
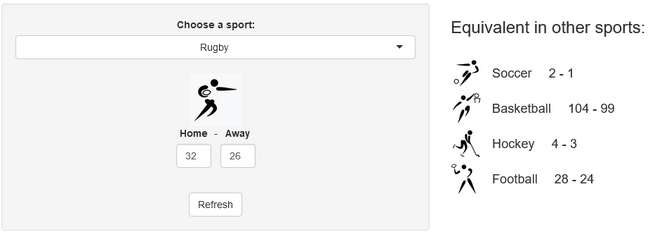
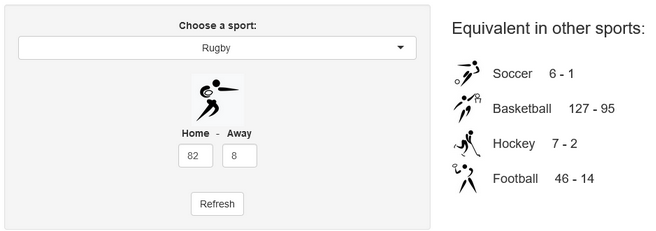
Last week, a stereotypical “French” ceremony opened the 10th Rugby World Cup in Stade de France, in the suburbs of Paris, France. As a small boy growing up in the southern half of France, I developed a strong interest for the sport. Now being an adult living and working in North America, where barely anyone has ever heard the word “Rugby”, I now rarely have anyone else to talk to about Antoine Dupont’s (captain of the French team and best Player in the world in 2021) prowess. Despite being very aware of this reality, I still wasn’t expecting the confused looks on my teammates faces when I casually brought up that I was excited for the World Cup to start during a Friday team meeting. I quickly stopped, before anyone asked more, all too aware that the confusion would only get worse if I had to start saying out loud scores like this 82-8 Ireland blowout or this 32-26 nail-biter involving Wales and Fiji.
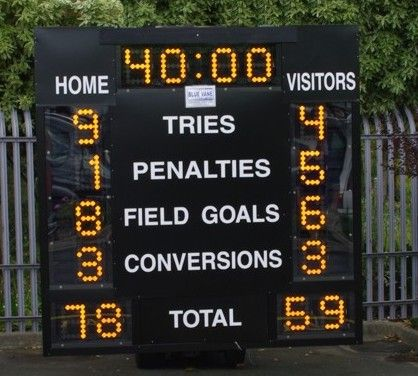
If you squinted at those numbers, keep reading! Sure, those might sound weird at first, but experiencing actions like this score is worth it! In this quick article, I’ll try to give you some explanations and comparisons to other sports grounded in data. Hopefully, in just a few minutes, you’ll be able to join in rugby gossip. And as a bonus, maybe you’ll learn a few things about data analytics in R along the way?
Descriptive data on games scores
First things first, if you don’t know how points are scored in Rugby, I recommend you take a look at this guide. Now, about the data. I have access to a dataset of all International games played between the 19th Century and 2020. Since both how the game is played and how points are scored changed a lot throughout the years, I restricted my dataset to games played since 1995 (close to 1,500 games total). The data and the code are available on GitHub. We can start with some descriptive statistics about scores. Our dataset contains offense, which is the number of points scored by the home team, and diff, the difference with their opponents points (so a negative number means the away team was victorious, and vice versa).
library(tidyverse)
df_sports_with_rugby <- readRDS("df_sports_with_rugby.rds")
desc_stats <- df_sports_with_rugby %>%
  group_by(sport) %>%
  summarize(avg_offense = mean(offense)
        	, med_offense = median(offense)
        	, sd_offense = sd(offense)
        	, avg_diff = mean(diff)
        	, med_diff = median(diff)
        	, sd_diff = sd(diff)
        	) %>%
  arrange(avg_offense %>% desc)
desc_stats
| sport | avg_offense | med_offense | sd_offense | avg_diff | med_diff |
| basketball | 102.65 | 102 | 10.98 | 2.57 | 3.0 |
| rugby | 33.59 | 30 | 16.00 | 6.86 | 6.0 |
| football | 27.21 | 27 | 08.04 | 2.48 | 2.5 |
| hockey | 3.77 | 4 | 1.43 | 0.27 | 1.0 |
| soccer | 2.07 | 2 | 1.33 | 0.50 | 1.0 |
As expected, basketball is the sport with the highest average and median winning scores. Rugby and football are fairly close to each other in that regard… which could give the impression that the score will look similar (Spoiler alert: they’re not!). Finally, standard deviations are not necessarily easy to read at first glance, but we immediately spot that despite having an average winner’s points 4 times below basketball’s, it’s standard deviation is higher. And Rugby is also an outlier in score difference. It has actually the highest average, median and standard deviation for diff. So clearly Rugby games are not expected to be close! Highest-level basketball and football on the other hand have an average score difference of just 2.5 points, which is below what you can get in just one action. This hints at very close games with exciting money time… so American! Finally, hockey and soccer have the lowest scores, and their average and median difference is also less than a goal.
One thing that I’d like you to notice is the difference between median and average scores (first two columns of the table above). The two numbers are extremely close for all sports… except Rugby. This suggests that something specific is happening at the tail of the distribution. To get confirmation, we can look at two additional metrics that give us more information about said tail. Skewness, when positive, indicates that accumulation is stronger above the median (below if negative). Kurtosis compares the size of the tail to that of the normal distribution: positive if the tail is larger and negative if lower. A large tail indicates that extreme events (in this case high total points scored) are more likely to happen compared to a variable whose distribution is normal.
In order to compute these two statistics in R, we’ll need the help of another package:
library(e1071)
tail_stats <- df_sports_with_rugby %>%
  group_by(sport) %>%
  summarize( skew_offense = skewness(offense)
        	, kurtosis_offense = kurtosis(offense)
        	, skew_diff = skewness(abs(diff))
        	, kurtosis_diff = kurtosis(abs(diff))
  ) %>%
  arrange(kurtosis_offense)
tail_stats| sport | skew_offense | kurtosis_offense | skew_diff |
| football | 0.14 | -0.15 | 1.26 |
| basketball | 0.25 | 0.36 | 1.45 |
| hockey | 0.46 | 0.40 | 1.18 |
| soccer | 0.94 | 1.44 | 1.24 |
| rugby | 1.78 | 5.50 | 2.01 |
Unsurprisingly, Rugby scores the highest in skewness and kurtosis for total points and point difference. All the other results are very interesting, and a little counter-intuitive. I would not have guessed that soccer would be second to last in that list ordered by tail size, with higher skewness and kurtosis for points and difference than hockey. However, finding football and basketball at the top only confirms the “American” bias towards close games. We can even notice that the Kurtosis of points scored in American football is negative, which makes it a “platykurtic” distribution. In other terms, we’d get a slightly wider total scores table if we simulated football scores from a normal distribution compared to reality. Finally, all the skewnesses of diff are positive. This means a clear accumulation on the positive side of the curve, which is where the home team prevails. In other terms, our 5 sports show signs of home field advantage. Neat.
We can also use ggplot2 to visualize these distributions, for example the home team score (offense):
adjust_offense <- 3 ## Visual factor to adjust smoothness of density
plot_distributions_offense <- ggplot(data=df_sports_with_rugby) +
  geom_density(alpha=0.3, aes(x=offense, fill=sport), adjust=adjust_offense) +
  # scale_x_log10() +
  scale_colour_gradient() +
  labs(x = 'Home team points', y='Density'
   	, title = 'Density plots of home team points') +
  theme_bw() +
  NULL
print(plot_distributions_offense)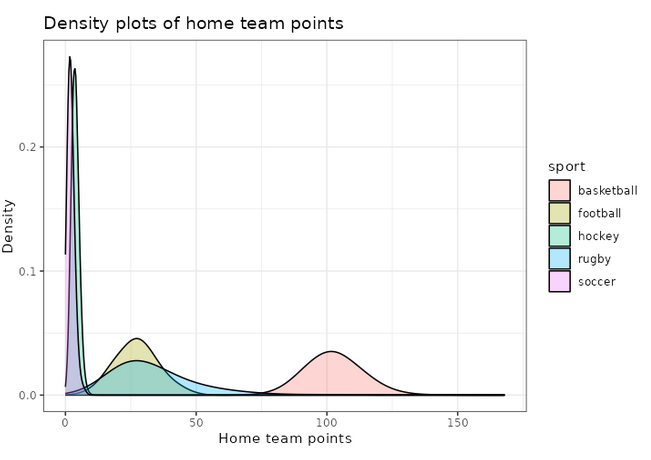
An interesting thing to plot is to focus specifically on football, and compare with a simulated normal distribution, which will show in dashed lines:
football_avg <- desc_stats[desc_stats$sport == 'football',]$avg_offense
football_sd <- desc_stats[desc_stats$sport == 'football',]$sd_offense
adjust_football <- 1.5
plot_distributions_offense_football <- ggplot(data=df_sports_with_rugby %>%
                                   	filter(sport == 'football')) +
  geom_density(alpha=0.3, aes(x=offense, fill=sport), adjust=adjust_football) +
  # scale_x_log10() +
  scale_colour_gradient() +
  labs(x = 'Home team points', y='Density'
   	, title = 'Density plots of home team points') +
  theme_bw() +
  geom_density(data=tibble(t=1:10000, x=rnorm(10000, football_avg, football_sd))
         	,aes(x=x), alpha=0.6, linetype='longdash', adjust=2) +
  NULL
print(plot_distributions_offense_football)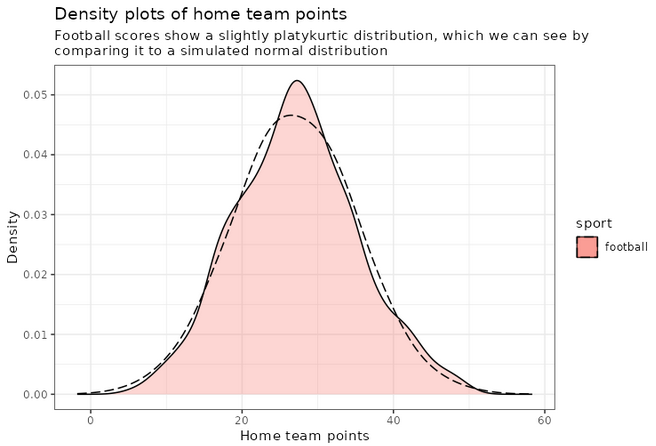
Notice how the distribution peaks higher than normal, and then (at least on the left side), plunges to 0 more quickly than the dashed line? This is negative kurtosis visualized for you. The left and right sides being on different sides of the dashed lines: this one is the positive skewness we noticed a few paragraphs ago.
Converting scores in other sports equivalents
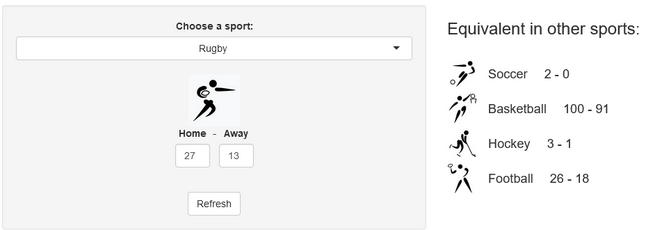
A few years ago, we created a scores converter app, which used comparisons between distributions to propose “equivalent scores” in different sports. Using my new Rugby dataset, all I had to do was add it to the app, and voila… we are now able to play with the app with Rugby and “translate” some of the confusing first round scores I mentioned in my opening paragraph into other sports in which we might be more fluent:
I’ll try to keep updating the new scores conversions as the World Cup progresses in our Mastodon and my personal (brand new) Threads. If you have any questions or just want to say hi, feel free to reach out there as well. Happy Rugby World Cup!