Oliver Roeder has a nice puzzle: the riddler. Just like last week, this week’s puzzle has an interesting application to the US Election and I enjoyed it really much, so I figured I might just write a blog post 🙂 In this article, we’ll solve this week’s riddler two different ways (just because :p) and discuss an indicator used on FiveThirtyEight’s prediction model for the election: the Voter Power Index.
Exact solution and Stirling approximation
I won’t write again the problem and notations, but you can find them here. We’ll also assume N is odd (as precised later by Ollie on Twitter). This assumption won’t matter much because we’ll only look at applications for large values of N. Let’s write:
\(\mathbb{P} = \Pr(you~decide~the~election)\)
Your vote is obviously going to be decisive if there is a tie between the N-1 other votes (convienently, N-1 is even). The votes are all independant with same probability p=1/2, so they are Bernoulli trials. Consequently, the probability we’re looking for is the probability that exactly half of these Bernoulli trial succeed, which is by definition the binomial distribution. Thus:
\(\mathbb{P} = {{N-1}\choose{\frac{N-1}{2}}} p^{\frac{N-1}{2}} {(1-p)}^{\frac{N-1}{2}} \)
As p=0.5, the exact value for the probability of your vote being decisive is thus:
\(\fbox{$\mathbb{P} = \frac{{{N-1}\choose{\frac{N-1}{2}}}}{{2}^{N-1}}$}\)
So, here is the exact solution, but it’s not super useful as is. Much more interesting is how this varies with N (with N sufficiently large). We can use Stirling’s approximation:
\(\log \mathbb{P} = \log {{N-1}\choose{\frac{N-1}{2}}} – (N-1) \log 2 \\~~~~\sim N \log N – \frac{N}{2} \log \frac{N}{2} – \frac{N}{2} \log \frac{N}{2} + \frac{1}{2} \left( \log N – \log \frac{N}{2} \\~~~~~~~- \log \frac{N}{2} – \log 2\pi \right) – N \log 2 \\~~~~\sim – \frac{1}{2} \log N + \log 2 – \frac{1}{2} \log 2\pi \)
Thus for sufficiently large N, the probability your vote is the decisive vote varies like the inverse of the square root of N:
\(\fbox{$\mathbb{P}\sim \sqrt{\frac{2}{N\pi}} \approx \frac{0.8}{\sqrt{N}}$}\)A very simple solution for large N
Actually, we could have obtained this result for large N much more simply. We know that asymptotically the binomial distribution is gonna converge to a normal distribution. The event that your vote is the decisive one is actually the most probable event, as probabilities that the other people vote for either candidates are equal to 1/2. So the solution to the riddler can be easily computed using the density of the normal distribution:
\(\mathbb{P} = \phi(0) = \frac{1}{\sqrt{2\pi \sigma^2}}\)with:
\(\sigma^2 = Np(1-p) = \frac{N}{4}\)(the variance of the binomial distribution), we get the same result as in the first paragraph:
\(\fbox{$\mathbb{P}\sim \sqrt{\frac{2}{N\pi}} \approx \frac{0.8}{\sqrt{N}}$}\)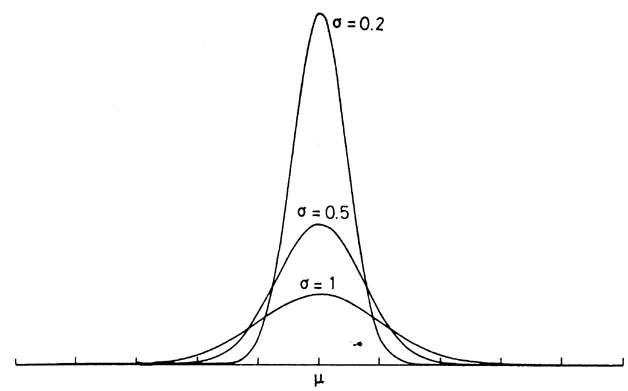
Voter Power Index
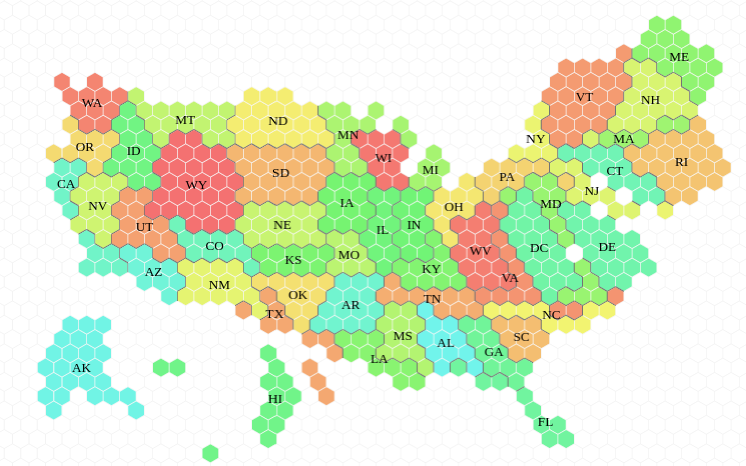
In the US Presidential election, voters don’t elect directly their preferred candidates, but “electors” who will eventually get to vote for the president. For example, California get 55 electors while Wyoming only get 3. But divided by the number of voters in each of these states, it appears that there are approximately 510 000 voters for each elector in California while only 150 000 voters get to decide an electoral vote in Wyoming. If we assumed that probabilities of voting for each candidate was equal in these states, we can use our formula to get the relative likelihood that one vote is going to change the outcome in the election in these two states:
\(\sqrt{\frac{510000}{150000}} \approx 1.8\)So in a way, a vote by a Californian is nearly 2 times less important than a vote cast in Wyoming!
Of course, probabilities are far from being equal for this year’s 2 candidates in California and Wyoming. And as Michael Vartan noted, the value of this probability matters very much!
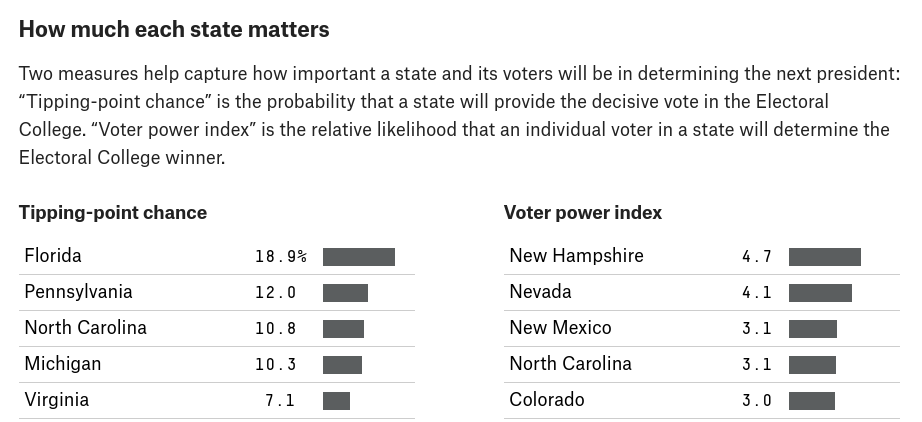
All parameters taken into account (also including the different configurations of the electoral college in other states), this is what Nate Silver call the Voter Power Index. For this year, the probabilities that one vote will change the outcome of the whole election is highest in New Hampshire and lowest in DC.
Featured image: Number of electoral votes per voter for each state. Made using the awesome tilegram app